Monostatic microwave imaging setup that includes the characterization of the field radiated by the Tx/Rx antennas
- Citation Author(s):
-
Yuri Alvarez Lopez
 (Universidad de Oviedo)
Fernando Las-Heras Andrés
(Universidad de Oviedo)
(Universidad de Oviedo)
Fernando Las-Heras Andrés
(Universidad de Oviedo)
- Submitted by:
- Yuri Alvarez-Lopez
- Last updated:
- DOI:
- 10.21227/2dbm-qc30
- Data Format:
 388 views
- Categories:
- Keywords:
Abstract
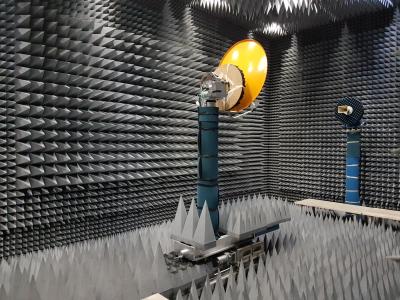
This dataset corresponds to the measurements of a monostatic microwave imaging system, collected using the facility described in [1].
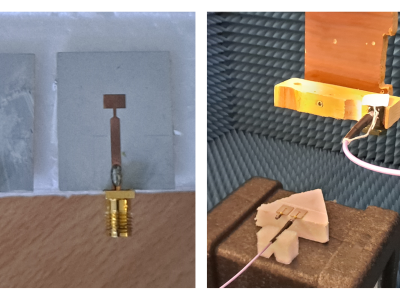
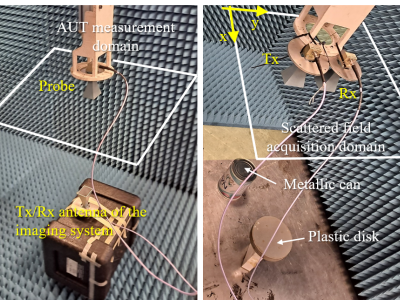
The first dataset, "Escatt_meas.mat", corresponds to the field scattered by the targets shown in the picture. Two targets were considered: a 18 cm long × 14 cm diameter metallic can, and a 18 cm diameter and 4 cm thick plastic disk, placed 22 cm above the metallic floor of the facility. The size of the scattered field acquisition domain was Lx × Ly = 65 cm × 40 cm, discretized every δx,y = 10 mm (λ/2 at the center frequency of 15 GHz), and placed 1 m above the floor of the measurement facility. The Tx and Rx antennas were two Standard Gain Horn (SGH) horn antennas [2].
The second dataset, "Erad_horn.mat" is the near field radiated by the Tx and Rx Standard Gain Horn (SGH) antennas in the 12-18 GHz frequency band. The field radiated by these antennas was measured in the same 12-18 GHz frequency band, in an acquisition domain discretized also every 10 mm, placed 50 cm above the SGH aperture. The field radiated by the SGH was processed using the backward transformation algorithm described in [3] to obtain the SGH aperture fields
This dataset can be processed following the methodology described in [4],[5] (modified Delay-and-Sum algorithm) and in [6] (modified Fourier-based imaging algorithm).
[1] A. Arboleya, Y. Alvarez, and F. Las-Heras, “Millimeter and submillimeter planar measurement setup,” in 2013 IEEE Antennas and Propagation Society International Symposium (APSURSI), 2013, pp. 1–2.
[2] (2022, 8) Specifications of the standard gain horn antenna SGH 639 from Narda. [Online]. Available: https://nscainc.com/wp-content/uploads/pdf/NARDA_640.pdf
[3] J. Hanfling, G. Borgiotti, and L. Kaplan, “The backward transform of the near field for reconstruction of aperture fields,” in 1979 Antennas and Prop. Society Intl. Symposium, vol. 17, 1979, pp. 764–767.
[4] Y. Alvarez Lopez and F. Las-Heras, “On the use of an equivalent currents-based technique to improve electromagnetic imaging,” IEEE Transactions on Instrumentation and Measurement, vol. 71, pp. 8004113, 2022.
[5] Y. Alvarez Lopez, J. Laviada, A. Arboleya, and F. Las-Heras, "A backpropagation imaging technique for subsampled synthetic apertures," IEEE Transactions on Instrumentation and Measurement, vol. 72, pp. 4502316, 2023.
[6] Y. Alvarez López and F. Las-Heras Andrés, "Improved Methods for Fourier-based Microwave Imaging," Sensors, Vol. 23, pp. 9250, 2023.
Instructions:
The submitted files are in *.mat format. Data acquired on a planar XY grid can be accessed and visualized using the Matlab script "plotMeasurements.m"
Measurements are stored in a 3D matrix where the first and second dimensions correspond to the x and y coordinates, and the third dimension corresponds to the frequency.
The x y grids (in m) as well as the list of frequencies are provided with each *.mat file
For questions or issues, please do not hesitate to contact us. Thank you.
Yuri Alvarez Lopez, alvarezyuri@uniovi.es