ECG PTB CLASSIFICATION DATASET
- Citation Author(s):
-
Pranav Singh Puri
 (School of Computer Science, University of Petroleum and Energy Studies (UPES), Dehradun, Uttarakhand, India)
Ayan Sar
(School of Computer Science, University of Petroleum and Energy Studies (UPES), Dehradun, Uttarakhand, India)
Sumit Aich
(School of Computer Science, University of Petroleum and Energy Studies (UPES), Dehradun, Uttarakhand, India)
Tanupriya Choudhury
(School of Computer Science, University of Petroleum and Energy Studies (UPES), Dehradun, Uttarakhand, India)
(School of Computer Science, University of Petroleum and Energy Studies (UPES), Dehradun, Uttarakhand, India)
Ayan Sar
(School of Computer Science, University of Petroleum and Energy Studies (UPES), Dehradun, Uttarakhand, India)
Sumit Aich
(School of Computer Science, University of Petroleum and Energy Studies (UPES), Dehradun, Uttarakhand, India)
Tanupriya Choudhury
(School of Computer Science, University of Petroleum and Energy Studies (UPES), Dehradun, Uttarakhand, India)
- Submitted by:
- Ayan Sar
- Last updated:
- DOI:
- 10.21227/j6fx-6p30
- Data Format:
 130 views
- Categories:
- Keywords:
Abstract
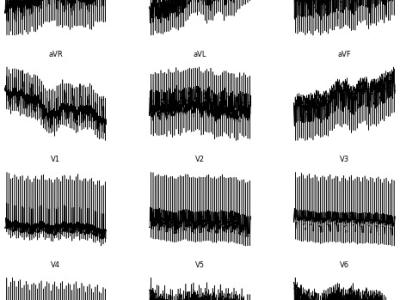
<p>Electrocardiogram (ECG) interpretation is critical for diagnosing a wide range of cardiovascular conditions. To streamline and accelerate the development of deep learning models in this domain, we present a novel, image-based version of the PTB Diagnostic ECG Database tailored for use with convolutional neural networks (CNNs), vision transformers (ViTs), and other image classification architectures. This enhanced dataset consists of 516 grayscale .png images, each representing a 12-lead ECG signal arranged as a 2D matrix (12 × T, where T is the number of time steps). The conversion pipeline transforms raw time-series signals from PhysioNet’s original dataset into normalized image representations by extracting diagnosis metadata, mapping SNOMED CT codes to diagnostic classes, and organizing images into labeled directories for supervised learning. Eight diagnostic categories are included, encompassing conditions such as myocardial infarction, cardiomyopathy, dysrhythmia, and healthy controls. By bypassing traditional time-series preprocessing and enabling plug-and-play compatibility with popular computer vision models, this dataset significantly lowers the barrier to entry for medical AI development and supports applications in transfer learning, prototyping, and educational use. The resulting dataset not only preserves the diagnostic richness of multi-lead ECGs but also enhances their accessibility for rapid deployment in machine learning pipelines.</p>
Instructions:
Dataset Overview: PTB Diagnostic ECG (Image Form) – Enhanced for Deep Learning
1. What is it? (Our Converted Dataset)
This dataset is a processed, image-based version of the original PTB Diagnostic ECG Database, specifically designed for deep learning tasks such as classification of cardiac conditions using convolutional neural networks (CNNs), vision transformers (ViTs), and other image-based models.
New Dataset Structure:
•
Data Format: .png grayscale images
•
Each Image: Represents a 12-lead ECG recording as a 2D matrix
o
Height = 12 (leads)
o
Width = Number of time steps (varies per sample)
•
Total Samples: 516 images (one per ECG record)
•
Classes: 8 diagnostic categories, based on SNOMED CT codes
•
Labeling: Each image is placed inside a class-named folder (e.g., Myocardial infarction/, Healthy control/)
•
Image Size: Optimized for ML input (e.g., auto-scaling can be applied during model training)
Folder Example:
...
This new dataset format enables out-of-the-box compatibility with image classification models, bypassing the need for complex time-series preprocessing pipelines.
2. What was the original dataset?
The original dataset was the PTB Diagnostic ECG Database, distributed by PhysioNet and Kaggle, containing:
•
Raw time-series ECG data stored in .dat and .hea files.
•
15 leads per record (12 standard + 3 Frank leads)
•
1000 Hz sampling rate
•
Diagnosis metadata embedded in the header file using SNOMED CT codes
3. How did we convert it?
Step
Description
1
Extract diagnosis codes from .hea files (#Dx: line)
2
Map SNOMED CT codes to diagnosis names
3
Load ECG signals with the wfdb library
4️
Select and normalize 12 standard leads
5
Stack leads into a 12xT matrix (2D image form)
6
Save matrix as .png grayscale image
7️
Organize images into folders based on diagnosis class
8
Compress folders for download, training, or sharing
4. Why is it important to convert it?
Benefit
Explanation
Deep Learning Friendly
Can be used with pre-trained CNNs and ViTs
Benefit
Explanation
Reduced Complexity
Avoids time-series preprocessing and custom RNN/CNN hybrids
Visualization
ECG patterns across leads are easily interpretable
Class-based Organization
Simplifies supervised learning pipelines
Broad Applicability
Ready for transfer learning, fine-tuning, medical AI deployment
5. Techniques Used
Tool/Method
Purpose
wfdb
Read ECG data from PhysioNet format
minmax_scale
Normalize ECG amplitudes between 0 and 1
matplotlib.imsave()
Save multi-lead ECG as grayscale image
tqdm, pathlib
Manage files and track conversion progress
shutil.make_archive()
Create zipped versions of labeled folders
6. Diagnostic Classes (SNOMED to Name Mapping)
python
Copy code
snomed_map = {
"164️865005": "Myocardial infarction",
"164️861001": "Cardiomyopathy",
"164️864️003": "Bundle branch block",
"4️27️17️2004️": "Dysrhythmia",
"164️866006": "Myocardial hypertrophy",
"164️867️002": "Valvular heart disease",
"164️868007️": "Myocarditis",
"4️267️83006": "Healthy control",
}
7. Applications
•
Deep learning model training for ECG classification
•
Feature extraction from ECG visual patterns
•
Transfer learning on medical signals
•
Model prototyping for cardiology AI tools
•
Educational purposes for signal-to-image transformation