Dental Tissue Absorption Spectroscopy
- Citation Author(s):
-
Daniel Martynek (University of Chemistry and Technology in Prague)Jindrich Charvat (Charles University in Prague)
- Submitted by:
- Ales Prochazka
- Last updated:
- DOI:
- 10.21227/x9f4-8r14
- Data Format:
- Research Article Link:
Abstract
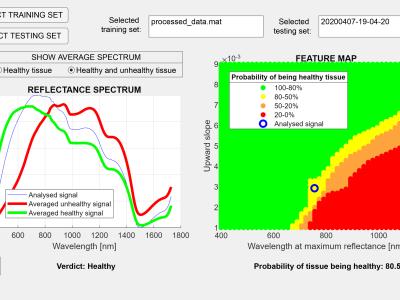
Oral health problems are closely associated with the analysis of dental tissue changes and the stomatologic treatment that follows. The associated paper explores the use of diffuse reflectance spectroscopy in the detection of dental tissue disorders. The data set includes 78 out of 343 measurements of teeth spectra in the wavelength range from 400 to 1700 nm. The proposed methodology focuses on computational and statistical methods and the use of these methods for the classification of dental tissue into two classes (healthy and unhealthy) by estimating the probability of class membership. Signal processing is based on the difference between the healthy and unhealthy teeth reflectance spectra in the infrared and visible ranges. Selected features associated with observed spectra are then used for machine learning classification based on the experience of an expert in stomatology during the learning stage. The dataset includes the graphical user interface for the use of absorption spectroscopy data in the evaluation of tissue quality changes.
Instructions:
The dataport includes:
1. The directory "ReflectanceData1" with 78 subdirectories of observed signals related to different tissues; each subdirectory includes 10 separate observations "*.txt" of signals for evaluation of reflectance spectra. Their assesment by an experienced stomatologist is summarized in the file "ReflectanceData1.xlsx"
2. The "ReflectanceRead.m" file to evaluate the reflectance from the selected in the "ReflectanceData1" directory
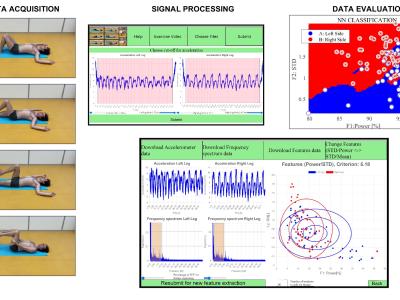
3. The "gui.mlapp" file that can be run in MATLAB 2022b to start the graphical user interface for classification of the given data (after their preprocessing with results in the "ProcessedData1.mat" file) and for classification of the selected measurement with evaluation of the probability of its membership in one two classes (healthy and unhealthy)
4. The "*.mp4" graphical video abstract
 295 views


