Dataset of Pathloss and ToA Radio Maps with Localization Application
- Citation Author(s):
- Submitted by:
- Cagkan Yapar
- Last updated:
- DOI:
- 10.21227/0gtx-6v30
- Data Format:
- Links:
 5302 views
- Categories:
- Keywords:
Abstract
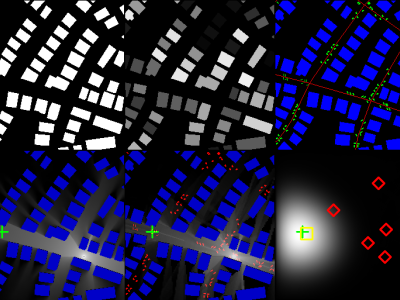
This dataset contains pathloss and ToA radio maps generated by the ray-tracing software WinProp from Altair. The dataset allows to develop and test the accuracies of pathloss radio map estimation methods and localization algorithms based on RSS or ToA in realistic urban scenarios.
Warning: Please consider using IRT2HighRes.zip instead of the IRT2 dataset in RadioMapSeer.zip.
More details on the datasets can be found in the dataset paper: https://arxiv.org/abs/2212.11777.
Instructions:
Please see our papers and code repositories (linked above) to see examples of how the datasets were used for radio map estimation and localization tasks with application of deep neural networks.
In the following, a brief description of the .zip files and their subfolders is provided.
RadioMapSeer:
- gain: Pathloss simulations in .png format for different propagation models: Intelligent Ray Tracing (IRT) with 2 (either a diffraction or reflection) and 4 maximum interactions of rays (IRT2 and IRT4, where the tiling size of the buildings is 100m), Dominant Path Model (DPM), all with (w/) and without (w/o) additional cars on the roads. 701 different 256x256 city maps and 80 transmitters (Tx) per map (with exception of 2 Tx per map for IRT4) are considered, i.e., 1402 simulations for IRT4 and 56080 for the other methods.
- png:
- buildings_complete: BW images of the 701 city maps.
- cars: BW images of the cars for each city map.
- roads: BW images of the roads for each city map.
- buildings_missing1-4: City maps w/o randomly picked 1-4 buildings. 6 random experiments in the subfolders.
- buildings_removed1-4: The removed 1-4 buildings.
- antennas: Black and white (BW) images of the 80 transmitters (Tx) for each city map in simulations, where the pixel of Tx is set white (255) and the rest is black (0).
- polygon:
- buildings_complete: Building polygons of the 701 city maps in .json files.
- buildings_and_cars: Building and car polygons of the city maps.
- roads: Coordinates of the road segments for the city maps.
- buildings_difference1-4: Building polygons of the city maps, where 1-4 buildings are randomly removed. 6 experiments.
- buildings_removed1-4: Polygons of the removed 1-4 buildings.
- antenna: Coordinates of the 80 Tx for each city map, in .json format.
- Dataset.csv: An example .csv file which can be used to fetch the data.
IRT2HighRes: Additional IRT2 simulations with multiple ray interactions (max. 2) for RadioMapSeer with 10m tiling length of the buildings.
IRT4HighRes: Additional IRT4 simulations for RadioMapSeer with 10m tiling length of the buildings. Simulations for all 80 Tx for each city map.
RadioLocSeer: This dataset is based on the test set of RadioMapSeer (99/701 maps).
- gain: Pathloss simulations in .png format for different propagation models: Intelligent Ray Tracing (IRT) with 2 (either a diffraction or reflection) and 4 maximum interactions of rays (IRT2 and IRT4, where the tiling size of the buildings is 100m), also their high resolution IRT2 and IRT4 counterparts (explained above), Dominant Path Model (DPM). All simulations provided in two versions: With (w/) and without (w/o) additional cars on the roads. 99 different 256x256 city maps and 80 Tx per map are considered. For DPM simulations, the radio map estimations by RadioUNet are also included in the corresponding subfolder (estimate).
- png:
- buildings: BW images of the 99 city maps.
- cars: BW images of the cars for each city map.
- roads: BW images of the roads for each city map.
- roadsBuilds: Images of the roads (red) and buildings (blue) for each city map.
- roadsBuildsCars: Images of the roads (red), cars (green) and buildings (blue) for each city map.
- antennas: Black and white (BW) images of the 80 transmitters (Tx) for each city map in simulations, where the pixel of Tx is set white (255) and the rest is black (0).
- polygon:
- buildings: Building polygons of the 99 city maps in .json files.
- buildingsCars: Building and car polygons of the 99 city maps.
- roads: Coordinates of the road segments for the city maps.
- antennas: Coordinates of the 80 Tx for each city map.
- mat: .mat and .npy files that contain the Tx and Rx positions used in the localization experiments in the linked papers.
RadioToASeer: The corresponding ToA values for the 99 city maps of RadioLocSeer, 80 simulations with different Tx locations for each map. The provided .mat file is of size (256,256,99,80).
RadioMap3DSeer:
- gain: 3D Pathloss simulations in .png format for IRT with multiple ray interactions (max. 2) with 10m tiling length of the building elements. 701 different 256x256 city maps and 80 Tx per map are considered. Building heights vary between 6.6-19.8 meters and Tx is deployed on a high building.
- png:
- buildings_complete: BW images of the 701 city maps.
- buildingsWHeight: Images of the 701 city maps with their height encoded in the pixel values (lowest 1, highest 255).
- antennas: Black and white (BW) images of the 80 Tx for each city map in simulations, where the pixel of Tx is set white (255) and the rest is black (0).
- antennasWHeight: Images of 80 Tx per map with Tx heights encoded in the pixel value.
- antennasBuildings: Images of the Tx (shown with a red plus sign) and buildings with height to illustrate the simulations scenarios of the dataset.
- polygon:
- buildings: Building polygons (2.5D) of the 701 city maps in .json files.
- antenna: 3D coordinates of the 80 Tx for each city map, in .json format.
For questions regarding the dataset and the related papers feel free to contact cagkan.yapar@campus.tu-berlin.de.


