CSI Dataset for Wireless Human Sensing on 80 MHz Wi-Fi Channels
- Citation Author(s):
- Submitted by:
- Francesca Meneghello
- Last updated:
- DOI:
- 10.21227/xbhv-f125
- Data Format:
- Research Article Link:
- Links:
 10111 views
- Categories:
- Keywords:
Abstract
The complete description of the dataset can be found at: https://ieeexplore.ieee.org/document/10144501
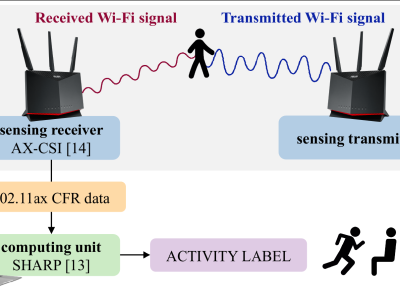
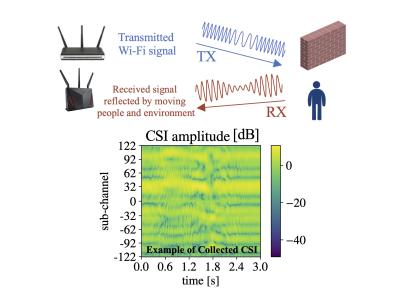
The dataset provides data to develop wireless sensing applications -- namely activity recognition, people identification and people counting -- leveraging Wi-Fi devices. Human movements cause modifications to the multi-path propagation of Wi-Fi signals. Such modifications reflect on the channel frequency response and, in turn, wireless sensing can be performed by analyzing the channel state information (CSI) of the Wi-Fi channel when the person/people move within the propagation environment.
The dataset consists of Wi-Fi channel readings for up to seven activities and ten people. The dataset is collected via a monitor router implementing the Nexmon CSI tool that estimates the channel frequency response of ongoing Wi-Fi transmissions. The monitored traffic is generated by an IEEE 802.11ac-enabled Wi-Fi router that transmits data to a receiving device using an 80 MHz bandwidth channel. The data is collected in seven different environments, i.e., a bedroom, a living room, a kitchen, a university laboratory, a university office, a semi-anechoic chamber and a meeting room. Different respective positions and different hardware for the transmitter, the receiver, and the monitor are considered to increase the domain diversity in the data.
The dataset aims to provide a common ground for the development and comparison of wireless sensing solutions based on Wi-Fi. Overall, the dataset contains more than thirteen hours of channel readings (for a total of 23.6 GB) among which six hours are for activity recognition, and the remaining is evenly split between person identification and people counting. The channel data is available for all the 242 Wi-Fi OFDM data sub-channels available on 80 MHz bands, and each of the four monitor antennas.
If you find the project useful and you use this dataset, please cite our articles:
@article{meneghello2022sharp,
  author={Meneghello, Francesca and Garlisi, Domenico and Dal Fabbro, Nicol\o' and Tinnirello, Ilenia and Rossi, Michele},
  journal={IEEE Transactions on Mobile Computing},
  title={{SHARP: Environment and Person Independent Activity Recognition with Commodity IEEE 802.11 Access Points}},
  year={2022},
  volume={},
  number={},
  pages={1-16}
  }

@article{meneghello2023dataset,
  author={Meneghello, Francesca and Dal Fabbro, Nicol\'o and Garlisi, Domenico and Tinnirello, Ilenia and Rossi, Michele},
  journal={IEEE Communications Magazine},
  title={{A CSI Dataset for Wireless Human Sensing on 80 MHz Wi-Fi Channels}},
  year={2023},
  volume={},
  number={}
  }
Instructions:
Dataset description
The dataset is structured in 26 sub-folders where the first eighteen sub-folders contain data for activity recognition (AR), and the remaining eight sub-folders are evenly split into data for people identification (PI) and people counting (PC) applications. Each sub-folder is associated with a specific measurement condition, i.e., monitored environment, Wi-Fi hardware, device position, people involved, and day of measurement. As an example, "AR-1b" means that the sub-folder contains data for AR, collected in the experimentation setup identified by number 1 during the second (b) campaign.
Part of the dataset has been used to validate SHARP, a robust remote sensing learning-based activity recognition algorithm. Useful code to process the data can be found on the GitHub repository releasing the SHARP implementation at https://github.com/francescamen/SHARP
Sub-folders named AR-xy, with x being a number and y a letter, contain data for activity recognition. The x and y indicate the specific setting as specified in the attached .pdf file. Files in an AR-xy sub-folder are named following the convention ARxy_Z.mat where Z is a letter indicating the activity performed by the person moving within the environment. We considered eight situations:
- E empty room
- W person walking within the environment
- R person running within the environment
- J person jumping in place
- L person sitting still
- S person standing
- C person sitting down/standing up
- G person doing arm exercises.
As an example, file "AR1c_J2.mat" represents the second trace (2) collected as the monitored subject is jumping (J).
Sub-folders named PI-xy contain data for person identification. Files inside such sub-folders are named PIxy_pN.mat where N is a number representing the person identifier. As an example, "PI2a_p06.mat" contains a CFR trace collected when the sixth person (P6) moved within the environment.
Sub-folders named PC-xy contain data for people counting. Files inside such sub-folders are named PCxy_nN.mat where N is a number indicating the number of people concurrently moving within the monitored environment. As an example, "PC1a_n04.mat" identifies a trace collected with four people concurrently moving.
The suffixes "p00" and "n00" indicate the traces associated with the empty environment.
Each .mat file contains the channel readings stored as an (N*N_{ant}) X M dimensional matrix where N is the number of channel estimates performed, N_{ant} is the number of monitoring antennas, and M is the number of available Wi-Fi OFDM sub-channels. While N depends on the specific campaign and can last from 6,000 to 50,000 samples (from 40 seconds to 5 minutes of recordings), N_{ant} =4 and M=242 remains constant over the dataset.
Note that, as the dataset is collected considering transmissions on an 80 MHz band, 256 sub-channels can, in principle, be monitored. However, Nexmon only returns the CFR for the M=242 data sub-channels -- indexed as {-122, \dots, -2} and {2, \dots, 122} -- while no information is provided for the control sub-channels.
Dataset collection workflow
The complete workflow implemented for the dataset collection develops as follows.
- Set up a single communication link between two Wi-Fi routers, one acting as the Wi-Fi AP and the other as the station. To this end, we modified the operating system of the routers by installing OpenWrt, a Linux operating system for embedded devices. The AP mode was enabled on the router by means of the host AP daemon (hostapd), which permits to specify the parameters for the Wi-Fi network through a user-defined configuration file. Specifically, the Wi-Fi network that was set up for the data collection worked on the IEEE 802.11ac channel number 42, with a central frequency of 5,210 MHz and a bandwidth of 80 MHz. After having enabled the AP mode on the first device, the WPA supplicant daemon was launched on the second device to enforce its connection to the just-created Wi-Fi network. We used Asus RT-AC86U IEEE 802.11ac or Netgear X4S AC2600 IEEE 802.11ac routers for this purpose.
- Set up an iPerf3 session between the Tx router (client) and the Rx router (server) and start data transmission by properly setting the bitrate to 173 packets per second so as to obtain an inter-packet distance of T_c = 6 ms. Note that the client and server entities in the iPerf3 client-server paradigm do not have a direct association with the AP-station entities in the considered Wi-Fi network, i.e., both the AP and the station can act as client or server for the purpose of this dataset collection. A single antenna was purposely enabled on the Tx and the Rx to enforce communication over a single spatial stream.
- Start Nexmon CSI on the monitor router (Asus RT-AC86U IEEE 802.11ac with 4 enabled antennas) to capture ongoing transmissions and estimate the channel frequency response (CFR) on a per-packet basis. Nexmon CSI saves the CFR data into the monitor device as .pcap files. See here the instructions to install and use the Nexmon CSI tool.
- Obtain the .pcap file containing the raw CFR data from the monitor router.
- Process the .pcap file on a computer through the Nexmon CSI Matlab script (available here) to obtain the corresponding .mat file containing the sequence of CFR vectors associated with an acquisition (referred to as CFR trace).
- Store the CFR trace (.mat file) as an entry of the dataset using the name format described above.
Notice that, in addition to the Tx, Rx and monitor devices, a computer is required to send control instructions to the devices. We chose to use wired connections to set up the control network, connecting the computer to the network devices via Ethernet cables. Hence, the latter were controlled by establishing secure socket shell (SSH) sessions over each Ethernet link and issuing the commands to set up the Wi-Fi network and the traffic exchange, and to start the data transmission (on the Tx) and the CSI collection (on the monitor).
Data processing
As part of our work, we made available a Python script to further process the data and obtain an M X N X N_{ant} dimensional matrix that may be shaped into a more convenient way for its use in sensing applications, as the CFR vectors estimated at different monitor antennas are stored separately (over the third matrix dimension). Moreover, we noted that the values returned by the Nexmon tool on the sub-channels from -63 to 122 need an inversion on the sign, probably due to hardware artifacts. The code implementing the processing (shape transformation and sign inversion) is available on the GitHub repository associated with the SHARP work at https://github.com/francescamen/SHARP. The repository also contains the implementation code of the CFR phase sanitization algorithm presented in SHARP, which allows removing the phase offsets introduced in the CFR recordings due to hardware artifacts. We refer the reader to SHARP for a thorough explanation of the offsets and the proposed sanitization strategy.
Other versions
A new version of the dataset with data from IEEE 802.11ax devices can be found at http://ieee-dataport.org/10840


