One of the grand challenges in neuroscience is to understand the developing brain ‘in action and in context’ in complex natural settings. To address this challenge, it is imperative to acquire brain data from freely-behaving children to assay the variability and individuality of neural patterns across gender and age.
- Categories:

PEMFC
- Categories:

Impulse response data used in article.
- Categories:
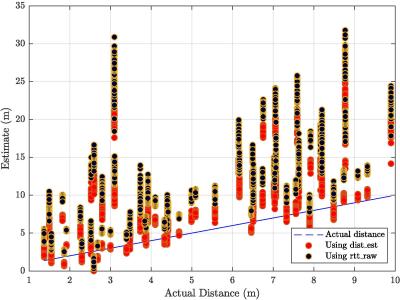
This dataset includes FTM WiFi measurements made with several ESP32-S2 devices in different indoor and outdoor environments. The measurements include the actual distance between devices as well as the RTT (Round Trip Time) values generated by the module.
# ESP32 S2 FTM Measurements
=========================
FTM measurements were created using several ESP32-S2 devices. They are presented in two different formats: rosbag (http://wiki.ros.org/rosbag) format and matlab format.
## ROS BAG records
The measurements can be found in the directories:
- AC
- Indoor
- Outdoor
The ROS messages are of type ESP32S2FTMRangingExtra and ESP32S2FTMRanging. These message types can be found in the following repository: https://github.com/valentinbarral/rosmsgs
The following fields are included within each message:
- anchorId: Identifier of the module that acted as beaconin the measurement.
- rtt_raw: RTT value averaged among the differentframes sent. In nanoseconds.
- rtt_est: RTT estimation created by the ESP32-S2firmware. In nanoseconds.
- dist_est: Distance estimation. Internally, the rttestvalue is used to calculate this value. In meters.
- num_frames: Number of frames successfully sent dur-ing the RTT communication.
- frames: A list of all successfully sent frames.
Each individual frame includes the following information:
- rssi: Received signal strength. In dBm.
- rtt: RTT value in that frame. In nanoseconds.
- t1: Outgoing timestamp of the first packet from thesender. In picoseconds.
- t2: Timestamp of reception of the ranging request at thereceiver. In picoseconds.
- t3: Timestamp of the response message at the receiver.In picoseconds.
- t4: Timestamp of reception of the response messagefrom the receiver at the sender. In picoseconds.
## Matlab logs
The measurements in matlab format are in the .mat file. This file includes four 1x1 struc elements:
- indoor
- outdoor20
- outdoor40
- sa
Each of these structures has the following fields:
- actualDist: Actual distance.
- rttRaw: RTT value averaged among the differentframes sent. In nanoseconds.
- estDistRaw: Distance estimate using rttRaw.
- absErrRaw: Absolute distance error of estDistRaw.
- rttEst: RTT estimation created by the ESP32-S2firmware. In nanoseconds.
- estDistEst: Distance estimate using rttEst.
- absErrEst: Absolute distance error of estDistEst.
- varRtt: variance of RTT
- meanRtt: mean of RTT
- countRtt: count of RTT
- meanRss: mean RSSI
- distEst: Distance estimate using own algorithm.
More info about this measurements can be found in the next paper (under review):
Fine Time Measurement in low-cost microprocessors for the Internet of Things
- Categories:

An efficient artificial scenerio generator for EV load simulation modeling has been developed acquiring probabilistic method for characterizing the stochastic nature of EVs and generate the schedule of EVs charging to ultimately achieve the EV load profile for impact study of EVs on distribution network. Model has been tested under different settings and by generating different scenarios to make it viable, realistic and adaptable to any defined characteristics.
- Categories:
This dataset contains segmented data of nine human knees. For each of the knees, the surfaces (vertices and faces) of the following structures are provided: femur, tibia, fibula, patella, and the contrast solution that was injected into the knee joint representing the volume that is available for the manipulation of surgical instruments.
Instructions can be found in the README file.
- Categories:

Exact BER Analysis for Two-user NOMA uUing QAM with Arbitrary Modulation Order
This code was tested using Matlab 2019.b
- Categories:

This data set is the capture of the Radio Frequency emissions from 9 IoT devices using an USRP Software Defined Radio. The data set is in MATLAB format and it stores the IQ samples of the signals in space. The data set can be used for experimental and analysis on Radio Frequency identification and authentication.
- Categories:

Cluster analysis, which focuses on the grouping and categorization of similar elements, is widely used in various fields of research. Inspired by the phenomenon of atomic fission, this paper proposes a novel density-based clustering algorithm, called fission clustering (FC). It focuses on mining the dense families of clusters in the dataset and utilizes the information of the distance matrix to fissure the dataset into subsets.
- Categories:
The dataset contains PMU measurements of all ten generators of IEEE 39-bus transmission system model, installed at the generators terminal. The dataset was obtained by using RTDS power system simulator and GTNETx2 based PMUs, and was stored by using Synchro-measurement Application Development Framework (SADF) Matlab library. Dataset constructs in total 86.6s of simulation and 5197 PMU measurements per generator.
The Matlab dataset in struct format contains:
- positive sequence voltage and current synchrophasor (magnitude and angle) measurements
- frequency measurements
- rate-of-change-of-frequency measurements
- delta frequency measurements from nominal system frequency
- corresponding measurement timestamps
- PMU measurement quality indicators.
To load dataset into Matlab use the following command: load('IEEE-39-bus_10_generator_PMU.mat').
- Categories: