Other
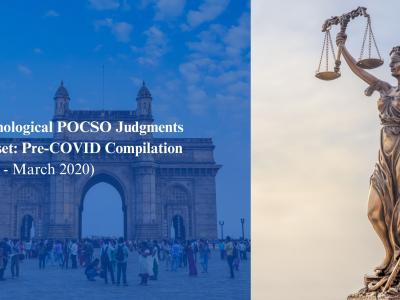
The Protection of Children from Sexual Offences (POCSO) Act was an important legislation that was enacted in India in 2012. It aims to safeguard children from sexual exploitation through various enforcement and legal redressal mechanisms. This dataset has been scraped from eCourts India Services using Python script which uses Selenium. We have mined apex and high courts’ judgements, which mentioned the POCSO Act and its respective sections. We have chronologically scraped POCSO judgements from 2012 to 2020 in the corpus.
- Categories:
 459 Views
The 10-machine 39-bus power system is a simplified model of the high voltage transmission system in the northeast of the U.S.A. (New England area). It was presented for the first time in 1970 and has since been often used for scientific research and publications. The 10-machine 39-bus power system consists of 39 buses, 10 generators, 19 loads, 34 lines and 12 transformers. This text describes the model of the 10-machine 39-bus power system and its parameters. In addition, the synchronous generator model and GFM converter model in related paper are also presented.
- Categories:
 582 Views
The intense diversity of the Next Generation Networking environments creates a dire need for a modular framework that can integrate with metric-based optimization constructs, to tackle on-demand service-centric and user-centric resource allocation scenarios. Our research offers a new evaluation mechanism to successfully replace traditional path ranking and path selection techniques. By applying the fundamental monotonicity and isotonicity properties of the Path Algebra framework, it can always lead to valid and optimal results.
- Categories:
 435 Views
The purpose of this study is to conduct a bibliometric analysis to investigate research trends, collaboration networks, and thematic evaluations of publications on the topic of ergonomic equipment for the elderly. It employs a systematic literature review using the PRISMA method to examine research trends, publication productivity, and citation impact in the selected topic. The analysis reveals a significant surge in research interest over the past decade (2013-2023), with substantial contributions from various academic journals in Scopus.
- Categories:
 52 Views
The IEEE Xplore database is vital in democratizing access to high-quality research datasets, fostering global collaboration, and promoting interdisciplinary studies. Insights from the IEEE Xplore database support applications in academic collaboration networks, predictive research trends, recommendation systems, and the evolution of scientific discourse. Our cirdc dataset extracts key information of all articles in the IEEE Xplore database using web data mining methods. Source codes and scripts for data collection are provided to promote transparency and reproducibility.
- Categories:
 113 Views
Developing robust benchmarking methods is crucial for evaluating the standing stability of
bipedal systems, including humanoid robots and exoskeletons. This paper presents a standardized benchmarking
procedure based on the Linear Inverted Pendulum Model and the Capture Point concept to normalize
the maximum angular momentum before falling. Normalizing these variables establishes absolute and relative
benchmarks achieving comprehensive comparisons across different bipedal systems. Simulations were
- Categories:
 79 Views
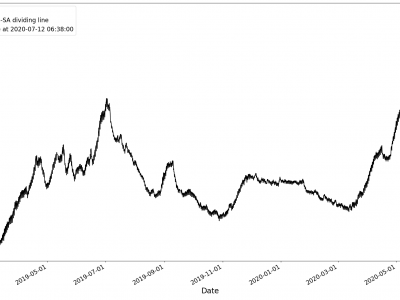
Missing values in the dataset were denoted as 999999.0. After replacing 999999.0 with NAN, it was found that the Zhaogezhuang well had 4522 missing values, and the Yutian Ji 03 well had 2076 missing values. Linear interpolation was used to fill these missing values. The datasets after filling are shown in Figures. The red dashed line in the figure indicates the dates that separate the seismically Active (SA) and seismically inactive (non-SA) periods.
- Categories:
 357 Views
The supplementary material contains the digital replication package of the systematic literature review including the detailed protocol, the corpus of papers that were in- and excluded, the lists of references and citations for each relevant report, and the lists of connected keywords to the topics of MBSE and decision-making from scopus.
- Categories:
 105 Views
The dataset contains Game stats for all matches in the League of Legends LEC Spring Playoffs 2024. It has 81 columns and 420 rows. Here is the description of the columns.
Dataset Contents:
● Player: Name of the player.
● Role: Role of the player (e.g., TOP, JUNGLE, MID, ADC, SUPPORT)
● Team: Name of the player's team
● Opponent_Team: Name of the opposing team
- Categories:
 418 Views
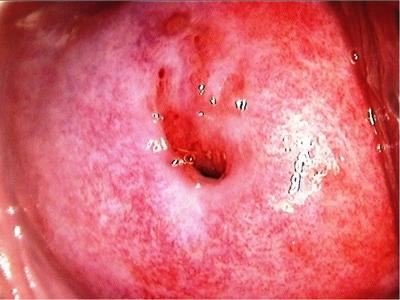
The Dataset is aquired from IARC Image Colpo Bank. Dataset contains Colposcopy Images of 200 patients.Colposcopy is a diagnostic procedure used to closely examine a woman's cervix, vagina, and vulva for signs of disease. It is often performed when results from a Pap test are abnormal. During a colposcopy, a colposcope—a special magnifying device—is used to provide an illuminated and magnified view of the tissues, allowing the healthcare provider to detect abnormal cells.
- Categories:
 945 Views


