Data of heating meters from residential buildings in Tomsk (Russia) for statistical modeling of the thermal characteristics of buildings

- Citation Author(s):
-
Pavel Zorin (CSO)
- Submitted by:
- Oleg Stukach
- Last updated:
- DOI:
- 10.21227/3r4e-ch18
- Data Format:
 1181 views
- Categories:
- Keywords:
Abstract
The large variability of system and types of heating load is a feature of the commercial metering of thermal energy. Heating consumption depends on many factors, for example, wall and roof material, floors number, system (opened and closed) etc. The daily data from heating meters in the residential buildings are presented in this dataset for comparing the thermal characteristics. These data are supplemented by floors number, wall material and year of construction, as well as data on average daily outdoor temperatures. Energy consumed by the building during the heating season may be an indicator of the heating supply of building. At the fixed comfortable temperature inside rooms (24 Celsius degrees) the thermal energy consumed by the building was measured. The smaller one, the better a quality of thermal protection, and the more efficiency of heating. This statistics can be useful for management to increase the energy efficiency of residential buildings.
Instructions:
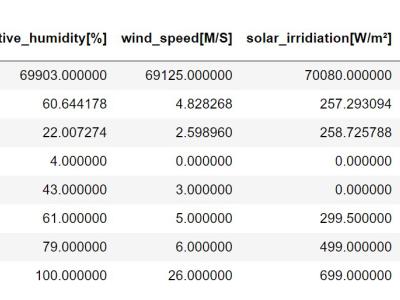
It is a simply Excel file. Each heating meter forms one daily record per day. The dataset has been collected during five heating seasons.
All table rows are following.
(A) - date in Windows format.
(B) - mass of the input water (heat carrier) per day.
(C) - mass of the output water. If the residential building has the open heating system (hot water is flowed from the heating system), (C) less than (B).
(D) - difference in volumes (C)-(B). For buildings with the opened heating system this is the data for analysis. In closed system it is the technological parameter allows observation for equipment.
(E) - average temperature of the heating carrier in the input of the heating system. It is the independent variable from home characteristics.
(F) - average temperature of the heating carrier in the output. It is the dependent variable both from (E) and heating consumption at building.
(G) - temperature difference, (F)-(E).
(H) - amount of the consumed heating in Gcal. It is calculated by formula (H)=(B)*[(E)-(F)].
(I) - ID of the heating meter. Some residential buildings have many heating meters.
(J) - date in the format year-month YYYYMM.
(K) - what is registrated, heating or heating plus hot water.
(L) - type of the heating system (opened or closed).
(M) - code system-load (4 digits). First digit 1 is opened system, 2 is closed system. The second digit 0 is heating, 1 is heating and hot water supply. The third and fourth digits is floors amount (01, 02, 03, ..., 17).
(N) - area of building that heating meter is served.
(O) - amount of building floors.
(P) - walls material.
(Q) - year of building construction.
(R) - total area of building.
(S) - outdoor temperature.


If possible, looking for the dataset used in this article. Thank you