Datasets
Standard Dataset
Merged ETT Dataset for Time Series Forecasting
- Citation Author(s):
- Submitted by:
- Harsh Mishra
- Last updated:
- Tue, 04/08/2025 - 02:16
- DOI:
- 10.21227/36xq-kh47
- Data Format:
- License:
 126 Views
- Categories:
- Keywords:
Abstract
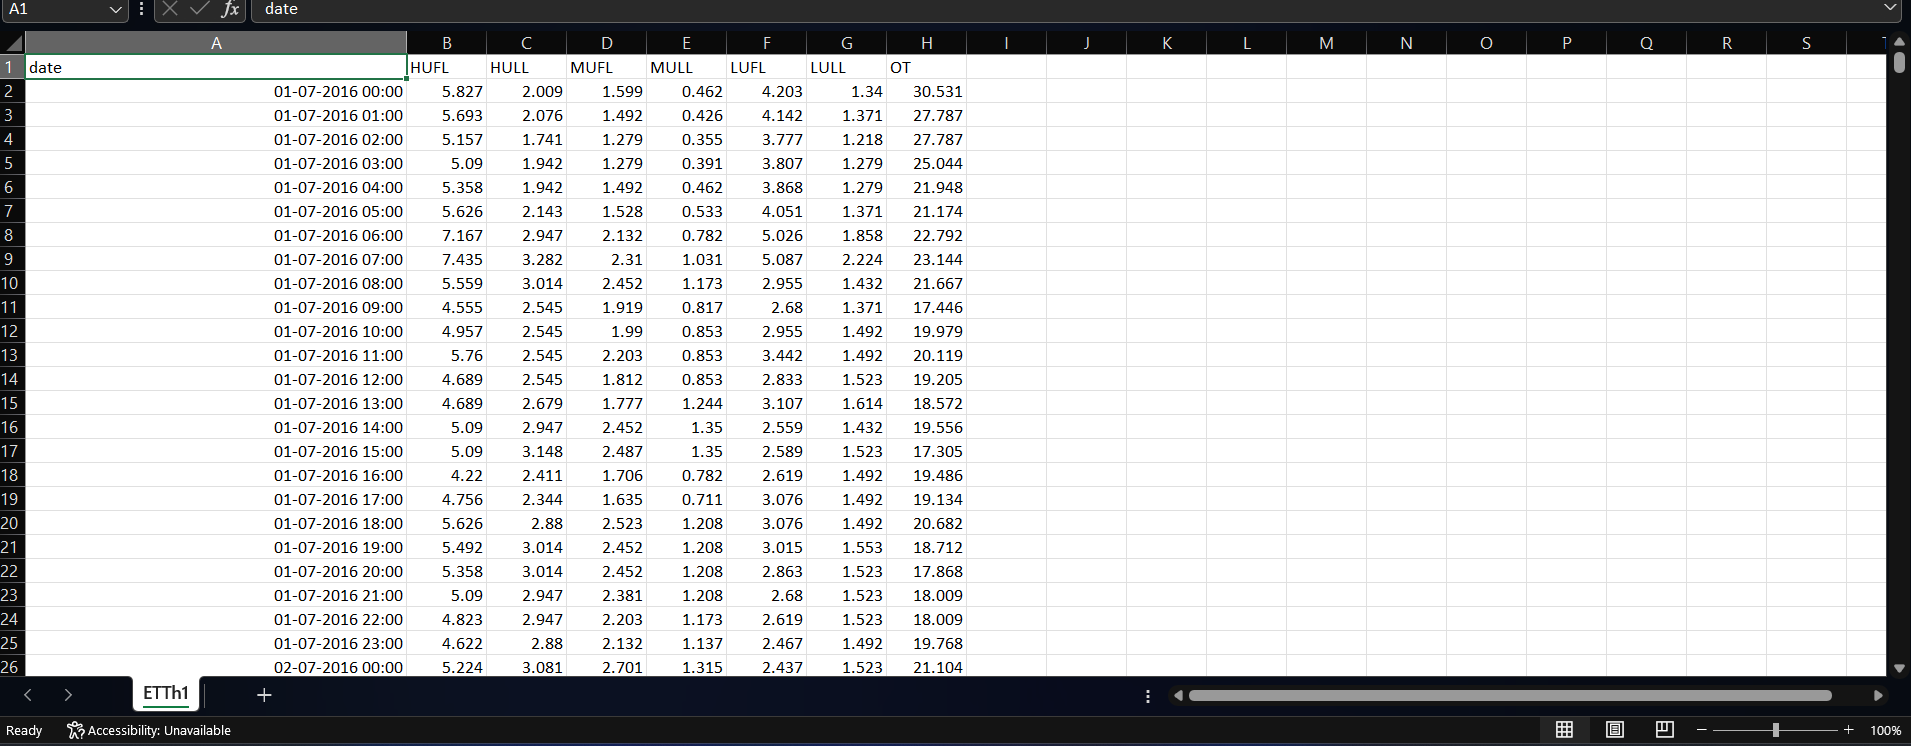
This dataset is a unified compilation of the Electricity Transformer Temperature (ETT) datasets: ETTh1, ETTh2, ETTm1, and ETTm2. It includes both hourly and minute-level temperature and load data collected from power transformers, which are vital for developing and benchmarking time-series forecasting models. The dataset contains features such as high and medium voltage transformer temperatures (HUFL, HULL, MUFL, MULL) and the operational temperature (OT), which serves as the primary prediction target. By merging the four datasets, researchers and practitioners can explore a more diverse and complex set of temporal patterns. This dataset supports a wide range of applications in energy forecasting, grid optimization, and predictive maintenance using traditional statistical methods and advanced deep learning models like Informer and Transformer.
Instructions for Using the Merged ETT Dataset:
-
Download the Dataset
Retrieve themerged_ETT_dataset.csvfile along with individual files (ETTh1.csv,ETTh2.csv,ETTm1.csv,ETTm2.csv) if you want to compare or analyze separately. -
Load the Dataset
Use Python withpandasto load the dataset:import pandas as pd df = pd.read_csv("merged_ETT_dataset.csv", parse_dates=["date"]) df.set_index("date", inplace=True) -
Understand the Features
-
HUFL,HULL: High-usage frequency limits (upper/lower) -
MUFL,MULL: Medium-usage frequency limits (upper/lower) -
OT: Operational Temperature (target variable)
-
-
Preprocessing Suggestions
-
Handle missing values if any (e.g.,
df.dropna()). -
Normalize the dataset using standard techniques (MinMaxScaler, StandardScaler).
-
For forecasting tasks, create windowed sequences of past
ntimestamps as input.
-
-
Modeling Guidelines
-
For statistical methods: Use ARIMA, Prophet, or Holt-Winters.
-
For deep learning: Suitable for LSTM, GRU, Transformer, Informer, Autoformer, etc.
-
Define the
OTcolumn as the target variable for prediction.
-
-
Use Cases
-
Long-term electricity demand forecasting
-
Anomaly detection in transformer operations
-
Predictive maintenance scheduling
-
Smart grid optimization and planning
-
-
Visualization
-
Visualize time series trends using:
df["OT"].plot(figsize=(15, 4), title="Operational Temperature Over Time")
-
-
Citing the Dataset
-
Please cite the IEEE DataPort page or corresponding data descriptor article if you use this dataset in your research or applications.
-
Dataset Files
- This zip archive contains a merged multivariate time series dataset (merged_ETT_dataset.csv) that consolidates data from the Ele dataset.zip (8.65 MB)
- This Python script is designed to load, preprocess, and visualize the merged Electric Transformer Temperature (ETT) dataset. It ett_analysis_script_fixed.py (922 bytes)
Documentation


