Depression

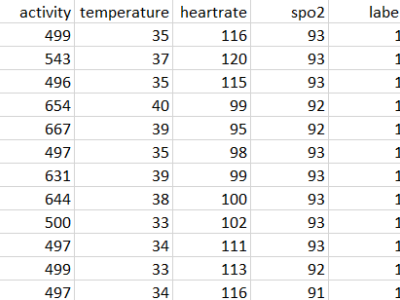
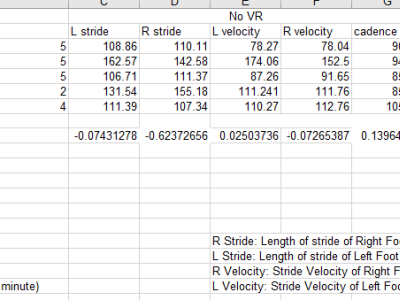
The dataset gives information about the different gait metrics such as stride length for left and right foot, stride velocity for left and right foot and cadence collected from human subjects


in a controlled environment in the presence of VR(virtual reality) scenes such as positve, negative and neutral. The PHQ-9 score of the subjects is collected and correlated with


the gait score. Decriptive statitics such as median are also collected for the difference in the gait values of specific VR environments.


Categories:
193 Views

The "Burn Depression Checklist Dataset" is a comprehensive dataset designed to aid in the analysis and understanding of depressive symptoms. The dataset is comprised of 2,600 entries, each corresponding to a unique individual, with 25 features that encapsulate various dimensions of depression, ranging from emotional and psychological symptoms to behavioral patterns.

Categories:
675 Views

We're excited to present a unique challenge aimed at advancing automated depression diagnosis. Traditional methods using written speech or self-reported measures often fall short in real-world scenarios. To address this, we've curated a dataset of authentic depression clinical interviews from a psychiatric hospital.


Last Updated On: 
Fri, 05/31/2024 - 10:55
Citation Author(s): 
Kaining Mao, Deborah BaofengWang, Tiansheng Zheng, Rongqi Jiao, Yanhui Zhu, Bin Wu, Lei Qian, Wei Lyu, Jie Chen, MinjieYe

A dataset comprising a total of 21 individuals has been meticulously compiled, with 9 individuals identified as exhibiting Major Depressive Disorder (MDD) based on the outcomes derived from the PHQ-9 Questionnaire. The remaining 12 individuals in the dataset are classified as non-MDD. 

The dataset encompasses diverse sensor data, including temperature measurements, SpO2 readings, pulse rates, and accelerometer data. It is important to note that all data points were collected within a controlled environment, ensuring reliability and consistency throughout the dataset.

Categories:
1515 Views

We have obtained data from May 2022 to October 2023 for our suggested framework modelling. This set of data incorporates seasonality-related speech, which we convert into text, Facebook, and Twitter posts. On the whole, 4646 data elements have been acquired, comprising 3716 representing affected individuals and the remainder of 930 representing unaffected individuals, which generated a proportional 4:1 ratio.

Categories:
392 Views