Wifi Fingerprinting Radio Map Database for Indoor Localization
- Citation Author(s):
- Submitted by:
- Abubakarsidiq Rajab
- Last updated:
- DOI:
- 10.21227/sdpr-fh91
- Data Format:
 1397 views
- Categories:
- Keywords:
Abstract
A reliable and extensive set of public WiFi fingerprinting radio map databases for researchers to implement, evaluate and compare Wi-Fi RSSI indoor localization schemes, the radio map database contains RSSI information from more than 400 APs collected during the conducted experiment on different days with the support of lab mates and volunteers.
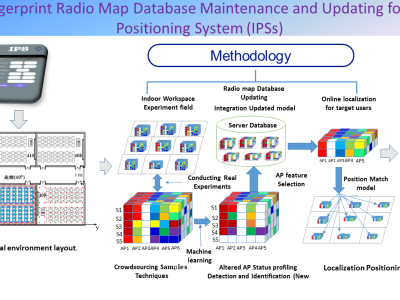
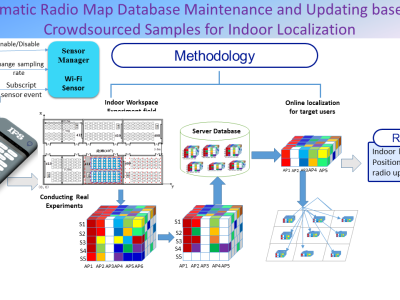
The measurement area is the partial area on the 4th floor of Building DJ, located at the East 9th Teaching Building of Huazhong University of Science and Technology. Meanwhile, the experimental area consists of 6 classrooms and a corridor with a total area of about 717 square meters. The size of the odd classroom is 10.5 × 9.56 square-meter. The size of the even-labeled classroom is 10.5 × 7.76 square meters, the corridor is 32.6 × 3.6 square meters, and the width of the concrete wall between each area is 0.3m.
Instructions:
Instructions:
The database Folder name "Experiments_Mx5DJ" includes
+ Mx5_SiteSurvey_DJ database,
+ Mx5_Test_DJ database,
+ Mx5_Supplement_DJ database.
Training (site Survey) & testing datasets are separated & collected at different times and locations.
* The general format for txt data files is:
RoomLabel represents the sub-area number, where 7, 8, 9, 10, 11, 12, and 13 correspond to the sub-area corridor, 408, 409, 410, 411, 412, 413, respectively; DevAdrLabel represents different data sets. The coordinates in the original datasets were measured and marked from the lower left of each subregion. Therefore, the actual coordinates of the samples in the sub-area corridor, 408, 409, 410, 411, 412, and 413, needed to add (982, 0), (1370, 2182.5), (0, 2182.5), (1370, 1105), (0, 1105), (1370, 27.5), (0, 27.5).
- Site Survey: Each sampling point is measured ten (10) times as the sampling data for the site survey, and the distance between two adjacent sampling points is 0.6m.
- Test: Each sampling point is measured 20 times as the sample data for generating the test fingerprint. , and the distance between two adjacent sampling points is 1m.
- Supplement: Each sampling point is measured five (5) times and taken in the gray areas and corridors in the figure.
- The format of the file txt is as follows: Each line represents a sample of: (bssid _1, bssid _2, ⋯ bssid _n, xLabel, yLabel, local label, Room Label, DevAdrLabel). The first n elements of each sample indicate the signal strength corresponding to different bssid.
- If the AP corresponding to the bssid is not received, its strength is represented by 0, xLabel and yLabel represent the actual coordinates of the sample, and the unit is cm; the local label represents the sampling sequence number at one sampling point at the same time.





I nees the dataset for research purposes