Wide-area Sentinel-1 SAR mosaics patches over Finland for semantic segmentation
- Citation Author(s):
-
Oleg AntropovSanja ScepanovicYrjö Rauste
- Submitted by:
- Oleg Antropov
- Last updated:
- DOI:
- 10.21227/hwq4-n214
- Research Article Link:
- Links:
 722 views
- Categories:
- Keywords:
Abstract
Here, a dataset used in manuscript "Wide-Area Land Cover Mapping with Sentinel-1 Imagery using Deep Learning Semantic Segmentation Models" Scepanovic et al. (https://doi.org/10.1109/JSTARS.2021.3116094) is published. The data contains preprocessed SAR backscatter digital numbers as 7000 geotiff image patches of size 512x512 (about 10 km x 10 km size) sampled from several wide-area SAR mosaics compiled from all summer Sentinel-1A images acquired over Finland in the summer of 2018. The geographical area where image patches are sampled covers the territory of Finland located to the south of 66.0∘latitude, which is nearly the whole country without Finnish Lapland. Southern Finland is primarily covered by boreal forests with lakes, marshes, open bogs, agricultural areas, and urban settlements. The SAR data are accompanied by reference ("ground truth") dataset representing 5 basic land cover classes produced based on Finnish version of CORINE Land Cover map, 2018.
Instructions:
Original SAR images were downloaded as Level-1 ground range detected (GRD) products. They represent focused SAR data that has been detected, multilooked and projected to ground range using an Earth ellipsoid. The images were orthorectified using the VTT's Technical Research Centre of Finland in-house software employing the local digital terrain model (with 20-m resolution) available from the National Land Survey of Finland. The pixel spacing of orthorectified scenes was set to 20 m. Orthorectification included terrain flattening to obtain the backscatter signal in gamma-naught format.
The scenes were further reprojected to the ERTS89/ETRS-TM35FIN projection (EPSG:3067) and resampled to a final pixel size of 20 m. The Sentinel-1 images were mosaiced into seven homogeneous SAR mosaics covering the whole territory of Finland. Each mosaic was compiled from approximately 90 Sentinel-1 IW images(both ascending and descending paths), and it took approximately 12 days to collect enough imagery to have the whole country covered. Altogether seven SAR mosaics were produced during summer 2018. These SAR mosaics are further used for sampling the training, development, and testing images.
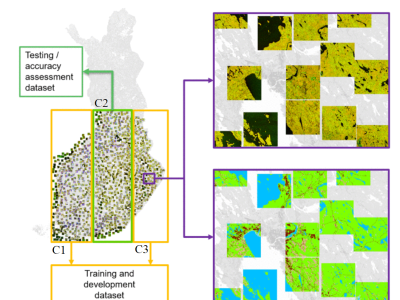
The sampling approach is illustrated in the Figure. Image patches from spatial area C2 were set aside for testing (2800 images), while image patches from C1&C3 (4200) were used in model training and validation.
Stored digital numbers represent backscatter amplitude DN. Geotiff files store two bands (VH- and VV-polarization data). Backscatter values in dB can be obtained as gamma0_dB =20*log10(DN/536)
However, amplitude DNs without dB-conversion were used in the manuscript by Scepanovic et al. https://doi.org/10.1109/JSTARS.2021.3116094
For further use in the Semantic segmentation suite, additional 3rd band, VH-to-VV ratio, had to be computed. Further, all bands need to be normalized as described in the paper, so that input value in range 0-255 are feeded to the deep learning models. After calculating the third ratio band, e.g. such coefficients can be applied: [ 255/186; 255/354; 255/1.1 ].
In principle, other pre-processing options are possible, including computing dB-values for VH and VV bands before the normalization.
Dataset Files
- label data ("ground truth") geotiff patches for area "C1" (Size: 32.63 MB)
- label data ("ground truth") geotiffpatches for area "C2" (Size: 34.51 MB)
- label data ("ground truth") geotiff patches for area "C3" (Size: 20.56 MB)
- Sentinel-1 (VH (Size: 582.13 MB)
- VV) geotiff image patches for area "C1" (Size: 585.03 MB)
- pt. 1/3 (Size: 872.41 MB)
- C2_Sentinel-1_data_pt1.zip (Size: 335.71 MB)
- C2_Sentinel-1_data_pt2.zip (Size: 335.13 MB)
- pt. 2/3 (Size: 334.88 MB)
- C2_Sentinel-1_data_pt4.zip (Size: 335.8 MB)
- C2_Sentinel-1_data_pt5.zip (Size: 335.74 MB)
- pt. 3/3 (Size: 333.73 MB)
- C2_Sentinel-1_data_pt7.zip (Size: 332.59 MB)
- VV) geotiff image patches for area "C2" (Size: 210.43 MB)
- pt. 1/7 (Size: 209.3 MB)
- C3_Sentinel-1_data_pt3.zip (Size: 209.41 MB)
- C3_Sentinel-1_data_pt4.zip (Size: 211.9 MB)
- pt. 2/7 (Size: 211.21 MB)
- C3_Sentinel-1_data_pt6.zip (Size: 208.43 MB)
- C3_Sentinel-1_data_pt7.zip (Size: 209.38 MB)


