Datasets
Standard Dataset
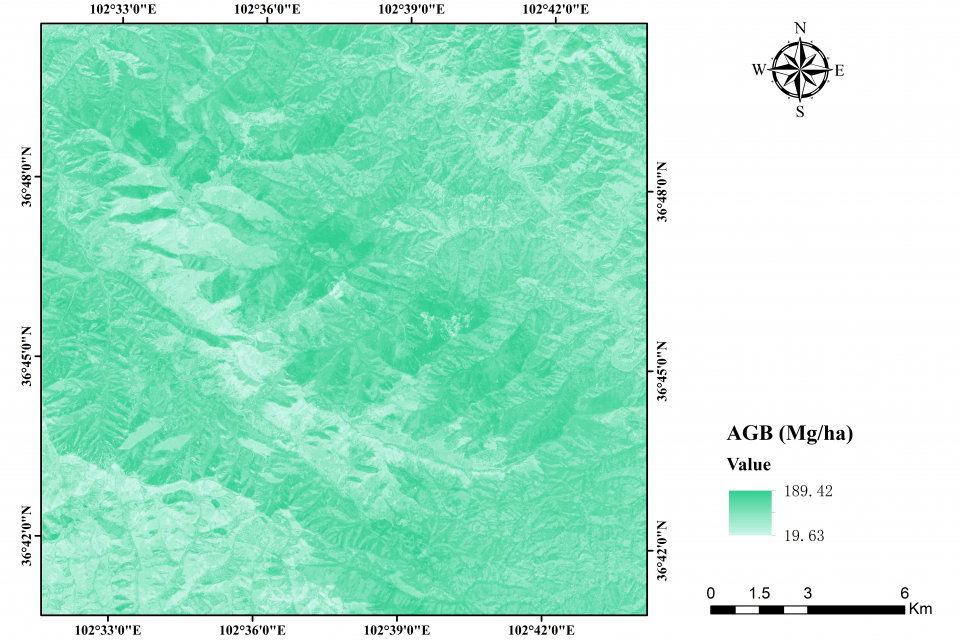
The inversion of forest aboveground biomass
- Citation Author(s):
- Submitted by:
- Xinran Yin
- Last updated:
- Mon, 03/04/2024 - 06:04
- DOI:
- 10.21227/e10w-2p26
- License:
 139 Views
- Categories:
- Keywords:
Abstract
Aboveground biomass (AGB) is a vital indicator for studying the carbon sink in forest ecosystems. Semi-arid forests harbor substantial carbon storage but received little attention as high spatial-temporal heterogeneity. This study assessed the performance of different data sources (annual monthly time-series radar: Sentinel-1 (S1), annual monthly time-series optical: Sentinel-2 (S2), and single-temporal airborne LiDAR) and seven prediction approaches to map AGB in the semi-arid forests at the border between Gansu and Qinghai provinces in China. Five experiments were conducted using different data configurations from SAR backscatter, multispectral reflectance, LiDAR point cloud, and their derivatives (polarimetric combination indices, texture information, vegetation indices, biophysical features, and tree height- and canopy-related indices). Results showed that compared to S1 (R2:0.24 - 0.45 and RMSE:47.36 - 56.51 Mg/ha), S2 acquired better prediction (R2:0.62 - 0.75 and RMSE:30.08 - 38.83 Mg/ha), although their integration further improved the results (R2:0.65 - 0.78 and RMSE:28.68 – 35.92 Mg/ha). The addition of single-temporal LiDAR highlighted the structural importance in semi-arid forests. The best mapping accuracy was achieved by XGBoost combining metrics from S2 and S1 time series and LiDAR-based canopy height information (R2:0.87, RMSE:21.63 Mg/ha, and RMSEr:14.45%). Images obtained during the dry season were effective for AGB prediction. Sequential forward selection was used to determine the most contributing predictors. Our methodology advocates for an economical, extensive, and precise AGB retrieval tailored for semi-arid forests.
S1:snap软件流程图处理:轨道校正→热噪声去除→辐射定标→多视→相干斑滤波(Refined Lee滤波器)→地形校正(Range Doppler terrain correction)→分贝化
envi软件附投影坐标(WGS_1984_UTM_Zone_49N),然后根据研究区范围裁剪。
数据范围:2017年1~12月每月各一副
S2:snap软件中的Sen2cor将L1C产品处理成L2A→重采样到10m分辨率(snap)→去掉1、9、10波段重新合成(envi)→裁剪
数据范围:18-1-15、17-2-14、18-3-11、17-9-17、17-10-27、17-11-1、17-12-11 (1月、2月、3月、9月、10月、11月、12月)
对于剩余的月份4、5、6、7、8月,四月份使用20年的影像,其它月份使用17-20年的多幅影像合成
合成步骤:1.将L1C每幅影像使用Sencor大气校正为L2A; 2.对每幅L2A进行10m和20m分辩率波段的提取;
3.分别对10m和20m波段文件夹进行重采样至10m并裁剪至研究区大小; 4.将3中生成10m分辨率波段进行合成,得到具有10个10m波段的tif影像
5.对这些云覆盖较多的影像进行合成(在相同月份基础上进行)①对所有影像进行云阴影掩膜;②按月份进行最小值合成,得到多幅影像拼接的无云影像,后续在此基础进行
变量提取:单波段、植被指数在合成影像上直接提取,生物物理变量例外(因snap生物物理处理器无法对合成影像直接提取,需对原始影像处理)
生物物理变量:①对L2A产品批处理重采样 ②对重采样后的文件分2A卫星和2B卫星进行生物物理变量批量提取③提取出的每幅影像存在较多云,通过envi对像元值进行分析,
对于FVC、FAPAR按月份最大值合成,LAI按月份第二大值合成。
配准
ENVI classic5.3与googleearth软件,先将S2与DOM配准,然后DOM与AGB_lidarplots配准,后续lidar变量也进行配准。
Dataset Files
- boundary.zip (54.99 MB)
- batch_resample10_4bio_Graph_toYXR.py (2.01 kB)
Documentation
| Attachment | Size |
|---|---|
| 2.92 KB |


