Indoor Received Signal Strength Data generated from ray-tracing
- Citation Author(s):
-
Shuai Sun
- Submitted by:
- Shuai Sun
- Last updated:
- DOI:
- 10.21227/r9n4-xz17
- Data Format:
 418 views
- Categories:
- Keywords:
Abstract
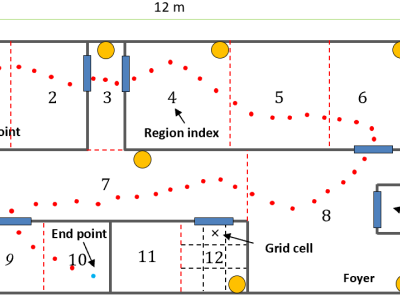
The dataset consists a training and testing folder with received signal strength (RSS) data, obtained from a ray-tracing software (Wireless Insite). There are K=8 anchor nodes and N=12 regions.
- In the folder _training, it contains 8 * 12 = 96 separate .p2m files, each file corresponds to a RSS data collected from a grid number of user locations (coordinate is given in the .p2m file) with respect to a certain Anchor node
- In the folder _testing, it contains 8 separate .p2m files corresponds to a RSS data set collected from a moving user trajectory locations (coordinate is given in the .p2m file) with respect to a certain Anchor node
Instructions:
In each .p2m file, the coordinate (X, Y, Z) of the target (transmitter in this case) is given, together with the distance with respect to the anchor node. The receiver signal power and phase is then calculated by ray-tracing, with the results printed at the end of each row.