Footstep analysis using Pressure Sensors
- Citation Author(s):
-
Edison A. Fuentes-Hernández
 (IEEE UTN)
Paul D. Rosero-Montalvo
Diego Peluffo
(IEEE UTN)
Paul D. Rosero-Montalvo
Diego Peluffo - Submitted by:
- Edison Fuentes
- Last updated:
- DOI:
- 10.21227/kqm6-1877
- Data Format:
- Links:
 1232 views
- Categories:
- Keywords:
Abstract
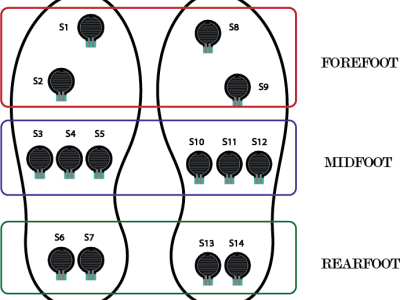
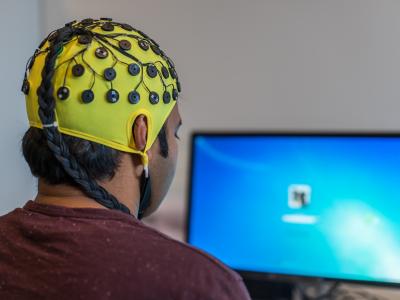
The pressure sensors are represented by black circles, which are located in the three zones of each foot. For the left foot: S1 and S2 cover the forefoot area. S3, S4, and S5 the midfoot area. S6 and S7 the rearfoot or heel area. Similarly, for the right foot: S8 and S9 represent the forefoot area. S10, S11, S12 the midfoot area. S13 and S14 the heel area. The values of each sensor are read by the analog inputs of an Arduino mega 2560.
Instructions:
Each label correspond to:
Label Position Pressure on sensors
1 normal footstep Left foot: S1, S2, S3, S4, S6, S7
Right foot: S8, S9, S11, S12, S13, S14
2 flat footstep Left foot: S1, S2, S3, S4, S5, S6, S7
Right foot: S8, S9, S10, S11, S12, S13, S14
3 cavus footstep Left foot: S1, S2, S3, S6, S7
Right foot: S8, S9, S12, S13, S14


Hi, can you explain how the data collected ? does it relates only for one instance ?
In reply to Hi, can you explain how the by Sheraz Farag
Hi, data collected was with Hernandez-Corvo análisis to assign the label of each sensors pressure. The analysis was with 300 people.