Other

We investigate whether hypothesis testing can be improved by a simple prompt to ‘think in opposites’, a strategy suggested by a growing body of literature as being beneficial in various reasoning and problem-solving contexts.
- Categories:
 249 Views
Computer experiment is crucial for marine controlled-source electromagnetic (CSEM) forward modeling in hydrocarbon exploration. Marine CSEM computer experiment is used to discretize the governing equations of the electromagnetic (EM) fields. One dimensional (1D) simulation usually is fully utilized to determine the reliability of the higher dimensional marine CSEM computations. All the data were generated using Web Hosted Active-Source Modeling (WHAM) online resource.
- Categories:
58 Views
The study investigates the relationship between people’s personality and the types of hats they like and would be willing to wear. The question is of interest for the psychology of personality and aesthetic preferences, empirical aesthetics, and potentially also for marketing studies. 539 Italian adults completed an on-line questionnaire showing black and white images of 34 iconic types of hat (set 1) and 8 types of baseball caps (set 2) one at a time. For each hat, they were asked to rate how much they liked it and how likely it was that they would wear it.
- Categories:
169 Views
Single-source shortest path (SSSP) discovery, one of a shortest path problem in algorithmic graph theory, is a combinatorial optimization problem. Most propositions solving the SSSP problem rely on Dijkstra’s algorithm. Although theoretically inferior in asymptotic upper bound time complexity, Dijkstra’s algorithm Binary variant outperforms Fibonacci variant empirically, in SSSP computations for real-world datasets, especially on sparse input graphs.
- Categories:
105 Views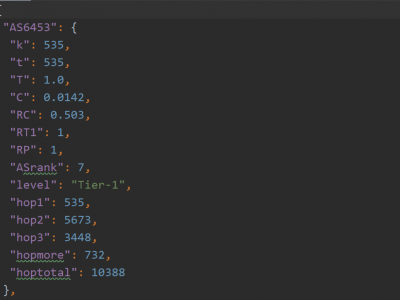
This dataset comprises Internet core network data inferred using the methodology detailed in the article titled 'Exploring Internet Evolution Through Analysis of its Core Network'.
- Categories:
131 Views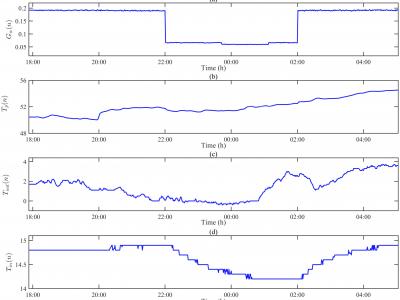
Dynamic models are indispensable for the optimization, prediction and control of thermal comfort in buildings.A new method is proposed for modeling the nonlinear dynamics of radiator-heated buildings and measuring modeluncertainties. The model uncertainty range obtained by the method can describe the uncertainties in the presence of model structure deviations and unknown noise distributions, without making restrictive assumptions that the noise follows a Gaussian distribution as in existing methods.
- Categories:
254 Views
When it comes to full-service home renovations and new construction, Vancouver residents know and trust Vibe Design Build. We are experts in making homes look and feel better, and we provide a wide variety of services to improve the aesthetics, practicality, and resale value of your home.
- Categories:
23 Views
The dataset includes the Stanford Bunny, Elephant, and Pony models, which have been processed with added noise to adapt to the proposed algorithm. Additionally, the data encompasses point clouds of residential areas obtained by LIDAR, also subjected to noise addition. This comprehensive dataset, with its various models and point clouds, serves to thoroughly test and validate the robustness and effectiveness of the proposed algorithm in handling noisy data from different sources.
- Categories:
261 Views
This is a data set about a practical explicit-time controller designing for a MIMO robotic system with proportional feedback. The robotic parameters are as follows: the weight is 35 KG; the arm span is 646 mm; the sample time is 0.0005s; the motor speed is 3000 RPM; the current signal amplification ratio is 1000; the motor maximum torque is [1.27, 1.27, 0.64, 0.318, 0.318, 0.159]^T (N \cdot m); the transmission ratio is [81.7853, 101.0453, 101.1892, 81.6735, 80.9486, 51.0270]^T.
- Categories:
49 Views
The noisy nanopore channel is introduced as a model of the nanopore sequencer in DNA storage that includes inter-symbol interference, sample duplications, and measurement noise. Information rates of the noisy nanopore channel with Markov sources are computed numerically based on a Monte Carlo technique that builds upon existing techniques for finite-state channels. However, the analogous technique for channels with duplications poses a challenging problem from an algorithmic perspective.
- Categories:
53 Views