Bearing fault recognition based on wavelet frequency band division and multi-level clustering_21_program_code
- Citation Author(s):
-
ShuXia Jiang
 (Central South University of Forestry and Technology)
Xia Liu (Central South University of Forestry and Technology)ChangWei Zhang (Central South University of Forestry and Technology)YuanYuan Liu
(Central South University)
ZeJiang He (Central South University of Forestry and Technology)
(Central South University of Forestry and Technology)
Xia Liu (Central South University of Forestry and Technology)ChangWei Zhang (Central South University of Forestry and Technology)YuanYuan Liu
(Central South University)
ZeJiang He (Central South University of Forestry and Technology) - Submitted by:
- Yuanyuan Liu
- Last updated:
- DOI:
- 10.21227/ehqm-ba90
 530 views
- Categories:
Abstract
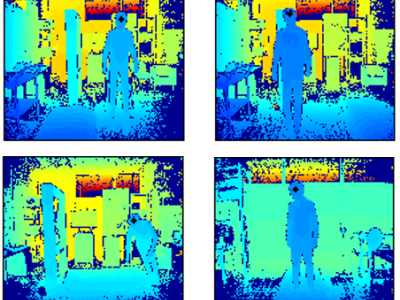
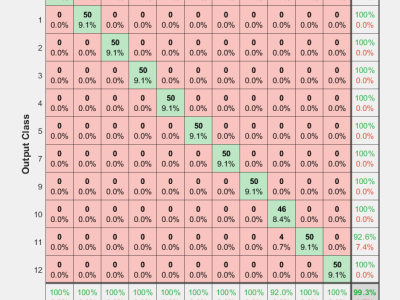
It is the key problem of machine condition monitoring to judge whether the rolling bearing has a fault or not and judge the fault location according to the noise signal. Aiming at this problem, a rolling bearing fault identification method is proposed based on Wavelet Frequency Band Subdivision (WFBS), Principal Component Analysis (PCA) and Multi-Level Clustering (MLC). Firstly, the original signals are divided into different Wavelet Packet Energy Spectrum indicators based on wavelet frequency bands, then they are combined with time-frequency domain indicators to form a parameter set. After PCA processing, the dimension of the parameter set is reduced to an appropriate dimension and the useful information is retained as much as possible. In this paper, the concept of WFBS and MLC are proposed to deal with the parameter set. The fault location and fault severity are determined in the form of confusion matrix graph through MLC. The experimental results show that this method can identify different fault types of rolling bearings with high accuracy and strong applicability, and displays practical significance in engineering applications.
Instructions:
Running instructions:
Procedure steps:
Required matlab version: Matlab 2018 b (or above).
There are four files (Package_wavlet_JSX.m,Package_wavlet_JSX.fig,three_cluster.m,three_cluster.fig) are important. All files are needed if you want to run this project correctly.
1. Open package_ wavlet_ JSX m file
2. click menu: Run
3. First,you can click "Copy xls delete txt data" to clear the cache
4. Select the imported data ("All data ") on the far right. It will take some time to load the data, and the time has passed when the main program command window appears Description (A messagebox shows 'Data loading completed').
5. Click the " PCA analysis" to get the contribution rate and recommendation dimension.
6. Click the "Multi- level Clustering" can help you to anthor GUI interface.
7. Select data of different dimensions according to require and click "Ffirst clustering", "Second clustering" and "Third clustering" in turn