Datasets
Standard Dataset
EEG signals of University Level Students Learning using Video and Text
- Citation Author(s):
- Submitted by:
- Mauricio Ramire...
- Last updated:
- Tue, 04/27/2021 - 09:06
- DOI:
- 10.21227/er9f-5b09
- Data Format:
- License:
 1621 Views
- Categories:
- Keywords:
Abstract
University level education is in constant evolution, making use of technological advancements in order to provide high quality pedagogical instruction to students. An important aspect of modern education is the contribution of Information Technologies,
as different technological resources can be implemented to provide education under a variety of teaching modalities. New learning modalities using modern technologies, such as dynamic lectures using live feedback from the students through wireless
devices and social-media educational platforms for student-teacher interaction, have shown increased acceptance rates in students when compared to more traditional teaching modalities. Due to the fast technological progress applied to education, teachers
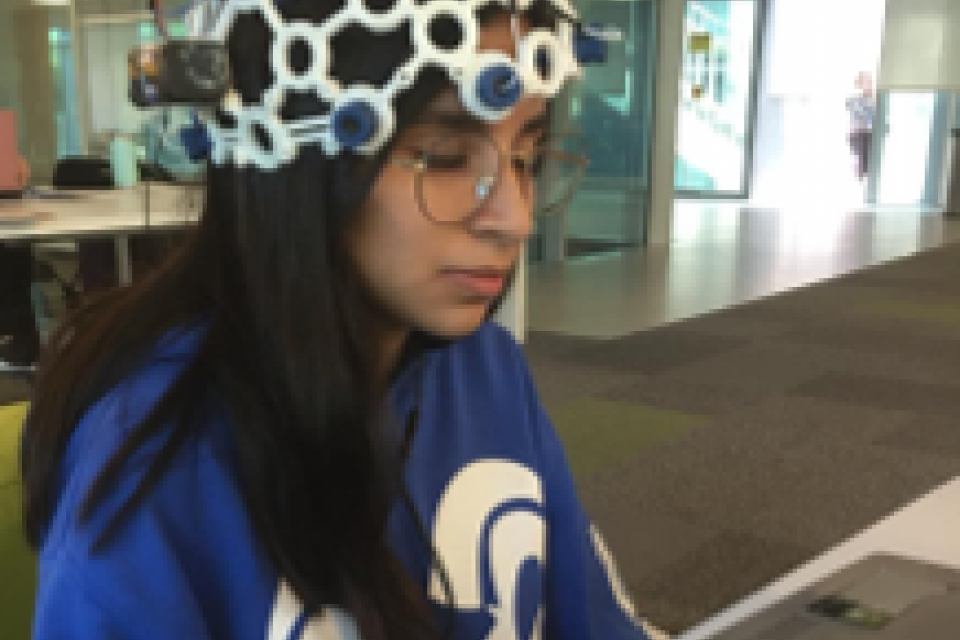
and students alike need to adapt quickly and adopt these new teaching modalities at a fast pace. Due to this reason, electroencephalographic (EEG) signals were  recorded in university level students, while learning under two different modalities (video and text).
This database contains EEG signals of participants in both groups, as well as the scores and exam times of three repetitions of learning tasks with increasing difficulty. This database could be used to relate cognitive performance of students, while learning under
different modalities. Intelligent models could be obtained to predict the cognitive performance of students by analysing their brain activity, which could be useful for students and educators to evaluate the efficiency of different learning/teaching methods.
This database contains a .zip with two folders inside
Video and Text
The folder Video contains:
1. EEG signals (.mat) of 10 participants and 3 repetitions of learning tasks, following this criteria:
S01R01, S01R02, ... S10R01 Contain the EEG signals of participants 1 to 10 in the first repetition
S01R02, S01R02, ... S10R02 Contain the EEG signals of participants 1 to 10 in the second repetition
S01R03, S01R03, ... S10R03 Contain the EEG signals of participants 1 to 10 in the third repetition
Each .mat file contains four matrices:
acc: Contains the acceleration from the OpenBcI.
samples: Contains the EEG signals from the OpenBcI (8 channels).
Srate: Sampling rate of the OpenBCI measurements (256 Hz).
time: Time vector for every data point in acc and samples.
2. Vscore.mat
Contains the (6 column) matrix Score_video:
Column 1, 3 and 5 contain the Test scores in Repetitions 1, 2 and 3 respectively
Column 2, 4 and 6 contain the Exam times in Repetition 1, 2 and 3 respectively
Each row shows the Test score or Exam time of each participant
The folder Text contains:
1. EEG signals (.mat) of 9 participants and 3 repetitions of learning tasks, following this criteria:
S01R01, S01R02, ... S09R01 Contain the EEG signals of participants 1 to 09 in the first repetition
S01R02, S01R02, ... S09R02 Contain the EEG signals of participants 1 to 09 in the second repetition
S01R03, S01R03, ... S09R03 Contain the EEG signals of participants 1 to 09 in the third repetition
Each .mat file contains four matrices:
acc: Contains the acceleration from the OpenBcI.
samples: Contains the EEG signals from the OpenBcI (8 channels).
Srate: Sampling rate of the OpenBCI measurements (256 Hz).
time: Time vector for every data point in acc and samples.
2. TScore.mat
Contains the (6 column) matrix Score_text:
Column 1, 3 and 5 contain the Test scores in Repetitions 1, 2 and 3 respectively
Column 2, 4 and 6 contain the Exam times in Repetition 1, 2 and 3 respectively
Each row shows the Test score or Exam time of each participant


Comments
I want this dataset