Optimal Configuration of Unequal Spacing Grounding Grid Enhancing Safety Parameters
- Citation Author(s):
- Submitted by:
- Jose Lira
- Last updated:
- DOI:
- 10.21227/h0a8-re08
- Data Format:
Abstract
Each sheet in this document meticulously details the electrical parameters of the grounding networks. Among all these parameters, touch voltage stands out as the most critical factor to consider in each evaluated conductor configuration.
The determination of these physical configurations is based on meticulous measurement of the distances between conductors on one side of the grid. It's important to note that in this context, square grids are being employed for grounding, which implies a specific arrangement of conductors.
What is highlighted in this report are the values selected as the most optimal for each of the configurations under evaluation. These values are crucial to ensure the effectiveness and safety of the grounding network in various situations and conditions.
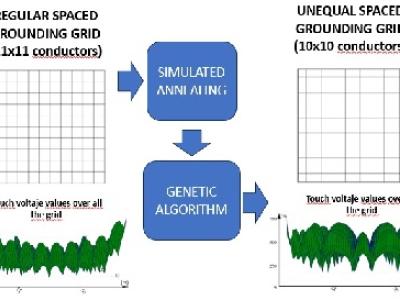
The first 150 items in this study pertain to the results obtained through the simulated annealing technique. Subsequently, configurations generated through three generations of genetic algorithms are included, further expanding the optimization possibilities.
At the conclusion of each of the four mentioned optimization stages, the top ten standout configurations that have emerged in the process are showcased. These highlighted configurations represent the result of diligent research and analysis and are designed to meet the highest standards of performance and safety in grounding systems.
Instructions:
On each sheet, the electrical parameters of the grounding networks are presented, with touch voltage being the most relevant parameter for each evaluated conductor configuration. These physical configurations are determined based on the distances between conductors on one side of the grid (bearing in mind that these are square grids). The values used in the report or selected as optimal for each configuration are highlighted.
The initial 150 items correspond to values obtained through simulated annealing, and then three generations of configurations generated using genetic algorithms are included. At the conclusion of each of these four optimization stages, the top ten configurations studied are displayed.
 64 views


