Sentinel 2 super-resolved data cubes - 92 scenes over 2 regions in Switzerland spanning 5 years
- Citation Author(s):
-
Daniela FAUR (CEOSpaceTech - Research Centre for Spatial Information, The Nation University of Science and Tehnology Politehnica Bucharest)Andreea GRIPARIS (CEOSpaceTech - Research Centre for Spatial Information, The Nation University of Science and Tehnology Politehnica Bucharest)Alexandru GRIVEI (CEOSpaceTech - Research Centre for Spatial Information, The Nation University of Science and Tehnology Politehnica Bucharest)Corina VADUVA (CEOSpaceTech - Research Centre for Spatial Information, The Nation University of Science and Tehnology Politehnica Bucharest)Vlad VASILESCU (CEOSpaceTech - Research Centre for Spatial Information, The Nation University of Science and Tehnology Politehnica Bucharest)Mihai DATCU (CEOSpaceTech - Research Centre for Spatial Information, The Nation University of Science and Tehnology Politehnica Bucharest)
- Submitted by:
- Daniela FAUR
- Last updated:
- DOI:
- 10.21227/aych-7e96
- Data Format:
- Research Article Link:
- Links:
 1993 views
- Categories:
- Keywords:
Abstract
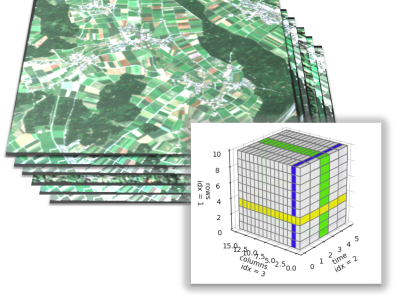
The Sentinel-2 L2A multispectral data cubes include two regions of interest (roi1 and roi2) each of them containing 92 scenes across Switzerland within T32TLT, between 2018 and 2022, all band at 10m resolution These areas of interest show a diverse landscape, including regions covered by forests that have undergone changes, agriculture and urban areas. Data sampling across the data cubes is not uniform, in each year there are 4 cloud-free scenes in July and no scenes in January or December. The Sentinel-2 data cubes benefit from the super-resolution mechanism implemented in [1] based on fully convolutional neural networks (CNNs) for up-sampling the low-resolution spectral bands of Sentinel-2 satellites up to 10m spatial resolution. A graphical interface focused on data cubes visualization, implemented in Tkinter, the standard Python interface to the Tcl/Tk GUI toolkit is available at https://github.com/andreeagriparis/SITSVisualization
[1] V. Vasilescu, M. Datcu and D. Faur, "A CNN-Based Sentinel-2 Image Super-Resolution Method Using Multiobjective Training", IEEE Trans. Geosci. Remote Sens., vol. 61, pp. 1-14, Jan. 2023.
[2] Andreea Griparis, Anamaria Rădoi, Daniela Faur, Mihai Datcu - Visual exploration of satellite image time series, IGARSS 2023, July 2023, Pasadena, California (to be published)
Instructions:
The folder contains the spectral bands of S2, all of 20m and 60m super- resolved at 10m resolution based on the algortihm described in this paper.
Spectral indices related to vegetation (AVI, EVI, GCI, GNDVI, MSI, NDVI, SAVI) have been calculated, of great interest being GCI and MSI at 10m resolution.
There is a graphical user interface (available at https://github.com/andreeagriparis/SITSVisualization) for data set visualization that was written using the following Python libraries: python=3.11, matplotlib=3.7, pandas=1.5, scipy, rasterio, tkinter, and spyder. It is entirely implemented in Tkinter, the standard Python interface to the Tcl/Tk GUI toolkit, and, it includes four areas:
- the first one serves the data loading
- the second one is for choosing the temporal evolution
- displayed in the third area, while
- the fourth area enables visual exploration of the loaded SITS on each of the three axes of the related data cube (time, rows, and columns /spatial coordinates).
In the data loading area, the user can load three grey level SITS with dimensions Rows × Columns × Time, and SITS metadata including the acquisition date of each image. The file format for the loaded SITS can be .npy, .mat, and .tif, while .csv and .pkl are used for metadata.
Displaying the images requires loading the series related to each band.
The .mat file must have version v4 and contain only one array variable.
The header for the .csv and .pkl files must be: name, day, month, year.


