Datasets
Standard Dataset
IEEE 118-Bus Cyber-Physical Power System Data Streams
- Citation Author(s):
- Submitted by:
- Ehsan Hallaji
- Last updated:
- Fri, 11/01/2024 - 11:58
- DOI:
- 10.21227/4v3d-wr73
- Research Article Link:
- Links:
- License:
 736 Views
- Categories:
- Keywords:
Abstract
This dataset consists of high-dimensional data streams collected from a cyber-physical 118-bus power system, offering a valuable resource for fault diagnosis and classification in large-scale smart grids. The data represents real-world challenges typical of cyber-physical systems, including computational complexity, measurement noise, and redundant data, all of which can impact model performance. This dataset is particularly suited for developing and evaluating feature engineering techniques—such as feature selection and dimensionality reduction—as well as classification algorithms to enhance diagnostic accuracy in high-dimensional settings. Researchers and practitioners can use this dataset to test and validate various approaches aimed at improving fault detection and classification in complex power systems, making it a significant asset for advancing data-driven methodologies in critical infrastructure.
Overview
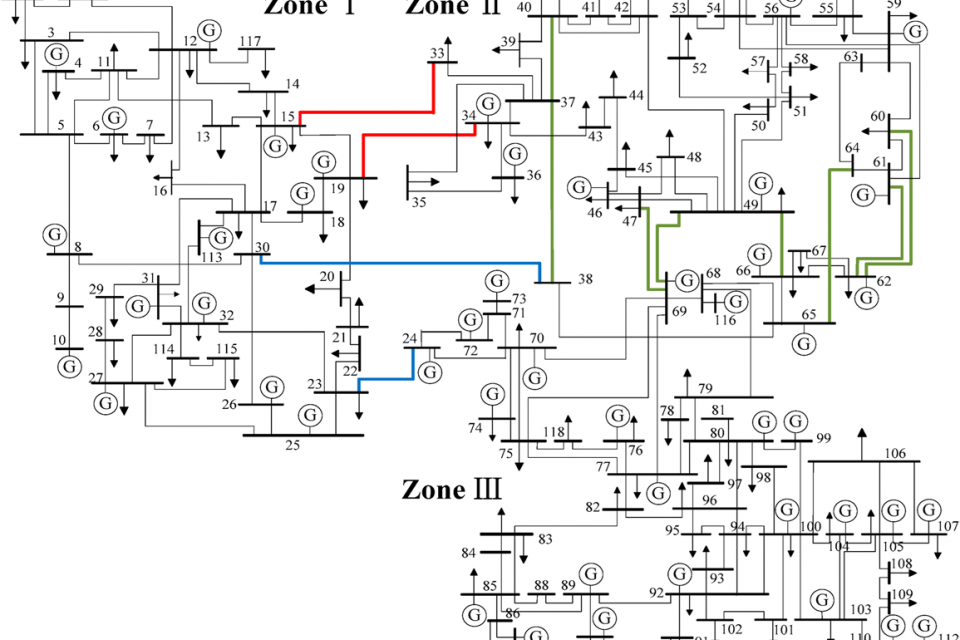
The IEEE 118-bus CPPS is a widely-used benchmark system in smart grid research that integrates physical components (generators, transformers, loads, transmission lines) with cyber components (protective relays, voltage regulators, controllers). This interaction is crucial for system stability and reliable power delivery.
Fault Scenarios
The data collection involves simulating various fault scenarios in the IEEE 118-bus CPPS using PowerFactory. Faults are categorized into:
- Load-Loss (LL)
- Generator Outage (GO)
- Generator Ground (GG)
Each fault type is simulated as follows:
- LL/GO Faults: A breaker disconnects the load or generator from the bus for 25 ms.
- GG Faults: Three-phase short-circuit faults are simulated between generation units and the ground.
Data is collected for 25 ms at a sampling rate of 10 kHz, resulting in 250 samples per scenario. The simulated fault scenarios include:
- 31 LL faults
- 19 GO faults
- 19 GG faults
- 1 normal operational state
Data Collection
Six datasets are constructed based on different Signal-to-Noise Ratio (SNR) and Fault Resistance (FR) values. Each dataset is detailed in the table below:
| Dataset | SNR (dB) | FR (Ω) | # Samples | # Features |
|--------------------------------|----------|--------|--------------|--------|
| data_1ohm_50db | 50 | 1 | 17,500 | 354 |
| data_1ohm_55db | 55 | 1 | 17,500 | 354 |
| data_1ohm_60db | 60 | 1 | 17,500 | 354 |
| data_10ohm_50db | 50 | 10 | 17,500 | 354 |
| data_10ohm_55db | 55 | 10 | 17,500 | 354 |
| data_10ohm_60db | 60 | 10 | 17,500 | 354 |
Collected Features
The features collected from each bus include:
- Voltage: 1 to 118
- Frequency: 119 to 236
- Phase Angle: 237 to 354
- This results in a total of 354 features per dataset. Labels (from 1 to 70) are included in column 355.
Citation
The data provided in this repository supports the research findings detailed in the following paper:
Hassani, H., Hallaji, E., Razavi-Far, R. et al. Learning from high-dimensional cyber-physical data streams: a case of large-scale smart grid. Int. J. Mach. Learn. & Cyber. (2024). https://doi.org/10.1007/s13042-024-02365-3
Please cite this paper if you use the data in your research.


