Datasets
Standard Dataset
fibrosis in NAFLD
- Citation Author(s):
- Submitted by:
- Iman Attia
- Last updated:
- Sun, 02/13/2022 - 11:38
- DOI:
- 10.21227/dr5j-gs46
- Data Format:
- License:
 208 Views
- Categories:
- Keywords:
Abstract
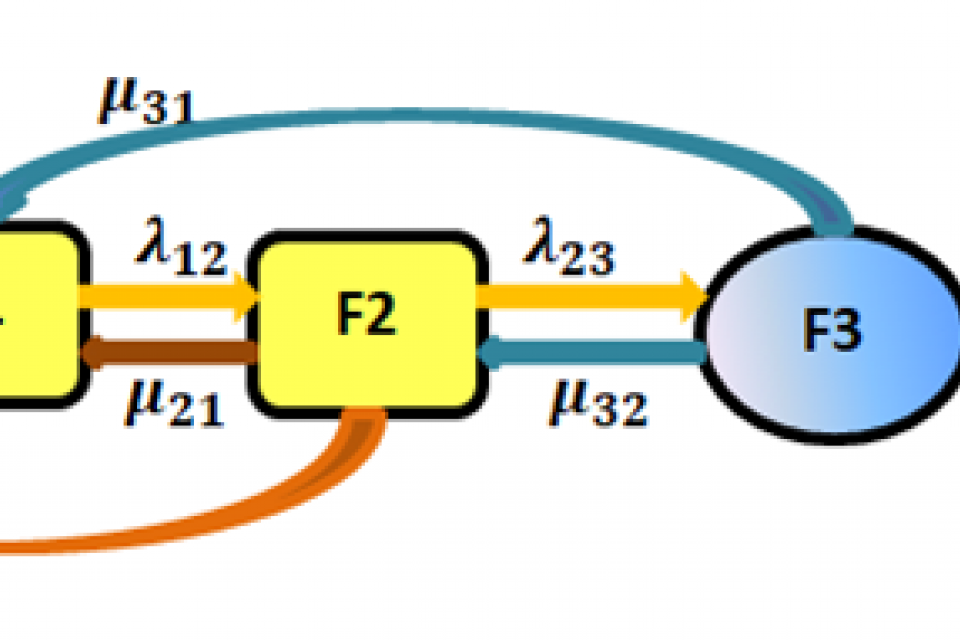
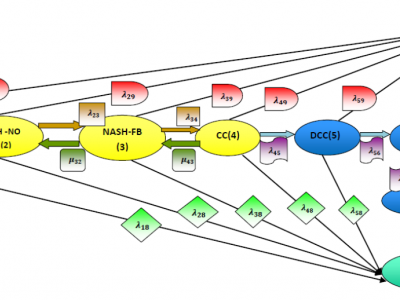
one hundred fifty patients were followed up every year for 28 years, and at each visit the characteristics of the patients were recoreded ( these are the predictors) like: sex( 0= female, 1= male) , age, BMI, LDL-chol, HOMA2-IR, systolic blood pressure and diastolic blood pressure. For each partipant, the recorded value is the mean of the follow up measurements. The age is the median value. The response variables are the transition counts among the states of the process of the disease ( fibrosis in NAFLD ) evolving over time . There are 9 different transitions. From state 0 to state 1 is denoted as lambda 01 . From state 1 to state 2 is denoted as lambda 12 . From state 2 to state 3 is denoted as lambda 23 . From state 3 to state 4 is denoted as lambda 34. From state 1 to state 0 is denoted as mu 10 . From state 2 to state 1 is denoted as mu 21 . From state 3 to state 2 is denoted as mu 32 . From state 2 to state 0 is denoted as mu 20 . From state 3 to state 1 is denoted as mu 31. For all the 150 participants, the counts of these transitions were recoreded in this whole 28 years of follow up, in other words, how many transition counts each patient had accomplished in this 28 years . Multivariate Poisson regression was used to relate the predictors to these counts , thus obtaing beta coefficients and incidence rate ratios for covariates in each model discribing each transition count. Then these estimated counts obtained from running Poisson regression was fed to continous time Markov chains ( one of the maultistate model ) to obtain the transition rate matrix and the transition probability matrix . This allow health policy makers and the medical insurance managers to estiamte the counts of a cohort of patients in the future time points , thus allocating the human and financial resources to investigate and treat patients with high risk factor to develop fibrosis in their course of the disease NAFLD . These risk factors are obesity , type 2 diabetes , hypercholestrolemis and hypertension . Insulin resistance as measured by the HOMA2-IR is the most deleterious risk factors among these factors .
the detailed discription of the data and statisitcal summary , results and discussion , all are present in the subblementary materials accompanied the article " Log-Linear Model and Multistate Model to assess the Rate of Fibrosis in NAFLD Ptients "
More from this Author
Documentation
| Attachment | Size |
|---|---|
| 12.48 KB |


