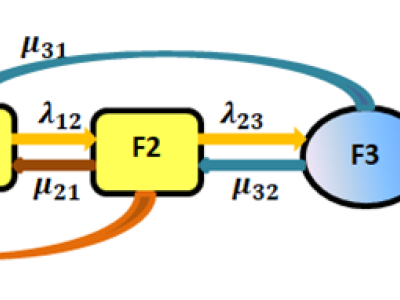
one hundred fifty patients were followed up every year for 28 years, and at each visit the characteristics of the patients were recoreded ( these are the predictors) like: sex( 0= female, 1= male) , age, BMI, LDL-chol, HOMA2-IR, systolic blood pressure and diastolic blood pressure. For each partipant, the recorded value is the mean of the follow up measurements. The age is the median value. The response variables are the transition counts among the states of the process of the disease ( fibrosis in NAFLD ) evolving over time .
- Categories:
