Dataset for Influence of Visual and Haptic Feedback on the Detection of Threshold Forces in a Surgical Grasping Task

- Citation Author(s):
-
John-John Cabibihan
(Department of Mechanical and Industrial Engineering, Qatar University, Doha, Qatar)
Ahmad Yaser Alhaddad(Department of Mechanical and Industrial Engineering, Qatar University, Doha, Qatar)
Tauseef Gulrez (Australian Public Service, Port Melbourne, Victoria, Australia)W. Jong Yoon (School of Science, Technology, Engineering, and Mathematics, University of Washington, Bothell, WA, USA) - Submitted by:
- John-John Cabibihan
- Last updated:
- DOI:
- 10.21227/apgp-3x82
- Research Article Link:
 485 views
- Categories:
- Keywords:
Abstract
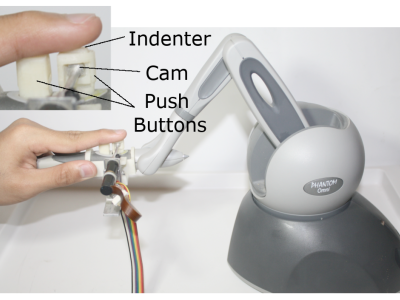
The datasets are related to the findings and results of our investigations of the minimal force thresholds perception in robotic surgical applications. The experimental setup included an indenter-based haptic device acting on the fingertip of a participant and a visual system displays grasping tasks by a surgical grasper. The experiments included the display of a set of presentations in three different modes, namely, visual-alone, haptic-alone, and bimodal (i.e., combined). Sixty participants took part in these experiments and were asked to distinguish between consecutive presentations. The experiments were randomized and the threshold forces were calculated based on certain algorithms. More details can be found with the related article.
Instructions:
The zipped file contains three folders as follows:
1. Anova analysis: Contains the datasets that were used in the anova analysis for presentations and force thresholds. Each file contains the iterations/threshold force for each participant for their visual-alone, haptic-alone, and bimodal experiments. It contains also the mean, standard deviation, and median across all participants for thre three experiments.
2. Force threshold vs Iteration analysis: Contains the datasets that were used in the analysis of force threshold over iterations for the three experiments. The datasets also contain the median threshold forces for every iteration across all participants in the last column.
3. Threshold force analysis: Contains a dataset that was used in the calculation of the mean threshold force of the last four reversals. The table at the bottom contains the mean and median of the threshold force for the last four reversals. Three tabs are available for each experimental mode.


