
Competition

Archived Competition

2 PHASE ENERGY METER 100A (2PEM-100A)

Submission Dates:
to
Citation Author(s):
Adrian Bazurto (Escuela Superior Politécnica del Litoral, ESPOL)
Víctor Asanza (Escuela Superior Politécnica del Litoral, ESPOL)
Ronald Reyes (Ecuaplus)
Douglas Plaza (Escuela Superior Politécnica del Litoral, ESPOL)
Diego Hernan Peluffo-Ordóñez (Université Mohammed VI Polytechnique)
Submitted by:
Victor Asanza
Last updated:
DOI:
10.21227/6f3r-t917
Data Format:
Links:
Categories:
Keywords:

Abstract

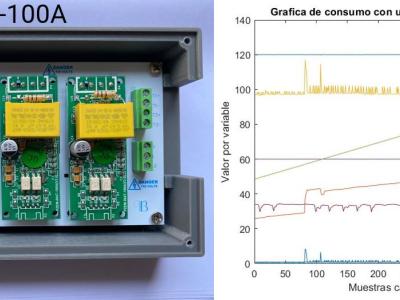
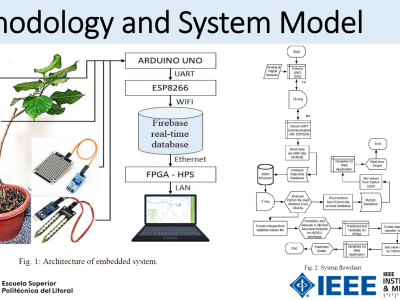
The 2 PHASE ENERGY METER 100A (2PEM-100A) is a power consumption monitor based on an embedded system. In the hope of promoting responsible energy consumption, we have decided to release this open source hardware project that was developed in the course "Development of Electronic Prototypes" at the ESPOL University. The 2PEM-100A allows to monitor the following parameters: Voltage (V), Current (A), Power (W), Frequency (Hz), Energy (KWh), Power Factor and Temperature (°C) of the 2PEM-100A.

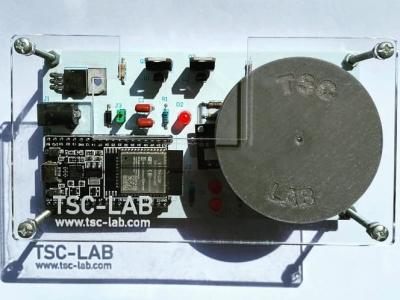
This dataset includes the monitoring of energy consumption of a Data Server that is working in the facilities of the Information Technology Center (CTI) of the Escuela Superior Politecnica del Litoral (ESPOL). The data acquisition equipment was 2PEM-100A. 2PEM-100A is open-source hardware based on the ESP32 hardware.

Open hardware Certification:

Link of 2 PHASE ENERGY METER 100A (2PEM-100A): 

Related scientific publications:

More related repositories:


Instructions:

The equipment used to perform these measurements was 2PEM-100A (https://2pem100a.blogspot.com/). The steps that were performed in the installation of the equipment 2PEM-100A for the recording of these data are available at the following link (Electrical Installation and Connections), as follows:

  1. Remove the cover of MCB-100A
  2. Remove the Jumper
  3. Conectar el Cable USB a un Computador
  4. Connecting the measuring coils
  5. Staple the coils to the load lines.
  6. Energizing the MCB-100A
  7. Install ARDUINO IDE on the Computer

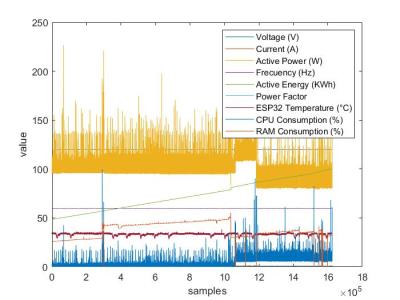
The data set includes 12 days of power consumption log at a sampling rate of 4 data per second (4Hz). The columns represent the following variables:

  • Voltaje (V)
  • Current (A)
  • Power (W)
  • Frecuency (Hz)
  • Energy (KWh)
  • Power Factor
  • Temperature ESP32 (°C)
  • CPU usage (%)
  • RAM usage (%)

To use the attached data (dataset.mat), please follow the step-by-step instructions described in the attached PDF files:

Source code used to program the measuring equipment (2PEM-100A):

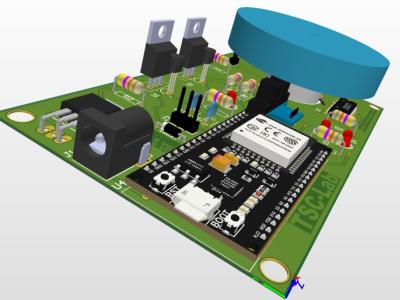
Design of the printed circuit board (PCB) of the measuring equipment (2PEM-100A):

Data processing codes using Matlab: 

More examples using dataset:

 
I am a university professor and I am interested in knowing what type of data processing you have used. The data would be useful for my signal processing class. Thanks you!
Veronica Ojeda Mon, 04/18/2022 - 16:03 Permalink
This is an excellent question. The data will present the following noises: 1.- Outliers, to remove them Hampel Filter (https://la.mathworks.com/help/signal/ref/hampel.html) was used. 2.- The measurements of the last weeks presented atypical measurements, thanks to the statistical analysis. Therefore, we worked with only 85% of all the data (https://github.com/vasanza/EnergyConsumptionPrediction/blob/master/main.pdf). Best regards
Victor Asanza Mon, 04/18/2022 - 16:14 Permalink
Is it possible to implement a system that allows me to deactivate loads when there is unnecessary energy consumption? For example, for cases where a device is left on (at night) and nobody is using it.
Kevin Chica Mon, 04/18/2022 - 16:07 Permalink

In reply to by Kevin Chica

Dear Mr. Kevin Actually the design of this system is non-invasive, we use hall effect coils (https://2pem100a.blogspot.com/2021/11/electrical-installation-and-connections.html) to measure the current. That is the reason why it is not possible to affect the behavior of a load. You can review the design at the following link: https://2pem100a.blogspot.com/p/pcb.html Best regards
Victor Asanza Mon, 04/18/2022 - 16:18 Permalink
In case of connectivity failure, does the system store data in non-volatile memory, and if it does, how long can it record data offline until running out of storage?
Galo Sanchez Mon, 04/18/2022 - 16:17 Permalink
Dear Mr. Galo Thank you for your question, as you can see in the PCB design (https://2pem100a.blogspot.com/p/pcb.html) the device does not have external memory. We use the internal memory, the Embedded Flash or PSRAM of the ESP32, which is 4MB. This memory would allow us to store up to 21 days of data records since we use data such as: Voltage (V), Current (A), Power (W), Frequency (Hz), Energy (KWh), Power Factor, ESP32 Temperature (°C). With a sampling frequency of 4 seconds. Best regards
Victor Asanza Mon, 04/18/2022 - 16:31 Permalink
would it be possible to upload the data to a cloud service directly from the embedded system? if so which cloud service would you use?
Guillermo Mont… Tue, 04/19/2022 - 00:35 Permalink
Dear Mr. Guillermo, thank you for your question. Yes you can send data to a server in the cloud, in fact here I share an example of sending data to ThingSpeak (https://2pem100a.blogspot.com/2021/12/practica-6-envio-datos-thingspeak.html) Best regards
Victor Asanza Tue, 04/19/2022 - 13:47 Permalink

In reply to by John Rivera

Dear Mr. John, Thank you for your question. The designed prototype has a 3D printed case (https://2pem100a.blogspot.com/2021/11/electrical-installation-and-connections.html). Unfortunately it is designed for indoor environments. But if placed in an IP65 case it could be used outdoors. Best regards
Victor Asanza Tue, 04/19/2022 - 13:50 Permalink
From the data, is it possible to make an ML model to make a prediction of consumption in the following month allowing to know an estimate of the electric bill?
Daniel Montoya… Tue, 04/19/2022 - 14:17 Permalink

In reply to by Daniel Montoya…

Hello Mr. Daniel, That's an interesting question. Just with the dataset we have trained models to make consumption prediction. At the moment the predictions are in hours, days and weeks. The RSME predictions are: 0.00589, 0.420344 and 10.49 KW; respectively. You can see the codes in the following repository: https://github.com/vasanza/EnergyConsumptionPrediction Best regards
Victor Asanza Tue, 04/19/2022 - 19:27 Permalink
Hello Mr. Jonathan, We just have a repository with example codes developed in Matlab (https://github.com/vasanza/EnergyConsumptionPrediction). We are working with code to process in python using keras, we will share it soon. Best regards
Victor Asanza Tue, 04/19/2022 - 19:31 Permalink
I have two questions: 1. The monitoring is in real time? 2. Is it possible to implement a visual or audible alert if abnormal behavior occurs (compared to prediction) ? Thanks.
Israel Jimenez Wed, 04/20/2022 - 01:31 Permalink
Hello Mr. Israel. Thank you very much for writing the questions. 1. The logging and monitoring of power consumption, if it is in real time. The prediction is not real time. 2. The second question is very interesting. It would be possible to implement alerts in case of abnormal behavior, but having more data to train a more robust model. Best regards
Victor Asanza Wed, 04/20/2022 - 14:38 Permalink
Their predictive model covers behaviors of a common residence? i.e., in winter more energy is consumed due to the heat, but in summer consumption drops, I understand that the dataset was obtained in the CTI facilities, a place with very different energy consumption behavior than residential.
Anthony Maisincho Wed, 04/20/2022 - 04:43 Permalink
Hello Mr. Anthony, Thank you for your question, indeed the data was recorded at the Information Technology Center (https://www.cti.espol.edu.ec/inicio), therefore, the consumption is different from that of a residence. But we noticed atypical behavior in the last months of registration, due to the return of presentiality. Nevertheless, the equipment designed (https://2pem100a.blogspot.com/p/pcb.html) can mend energy consumption in residences. We will soon share a dataset with these measurements. Best regards
Victor Asanza Wed, 04/20/2022 - 14:46 Permalink
Is there a possibility of training an algorithm for load/inertia control with respect to an induction motor using these data in real time?
Christian Castillo Sat, 04/23/2022 - 18:41 Permalink
It is known that unproperly maintained electrical devices may have some part of their circuit barely shorted to ground. Since the produced leakage current is usually low, in most cases it does not seem to affect functionality. However, this current can significantly increase energy consumption costs in the long run. As it does not stop the device from working, it can only be detected by comparing phase and neutral currents, that should be equal if everything is doing fine. Does the 2PEM-100A measure both phase and neutral current? If not, what modifications may be made in hardware to add this feature?
Jose Landivar Fri, 04/29/2022 - 22:59 Permalink