Datasets
Standard Dataset
Indoor Corridor and Outdoor Open area Received Power Data at 28 GHz using PXI Channel Sounder
- Citation Author(s):
- Submitted by:
- Wahab Ali Gulza...
- Last updated:
- Mon, 10/25/2021 - 12:40
- DOI:
- 10.21227/p3am-2r25
- Data Format:
- Links:
- License:
 383 Views
- Categories:
- Keywords:
Abstract
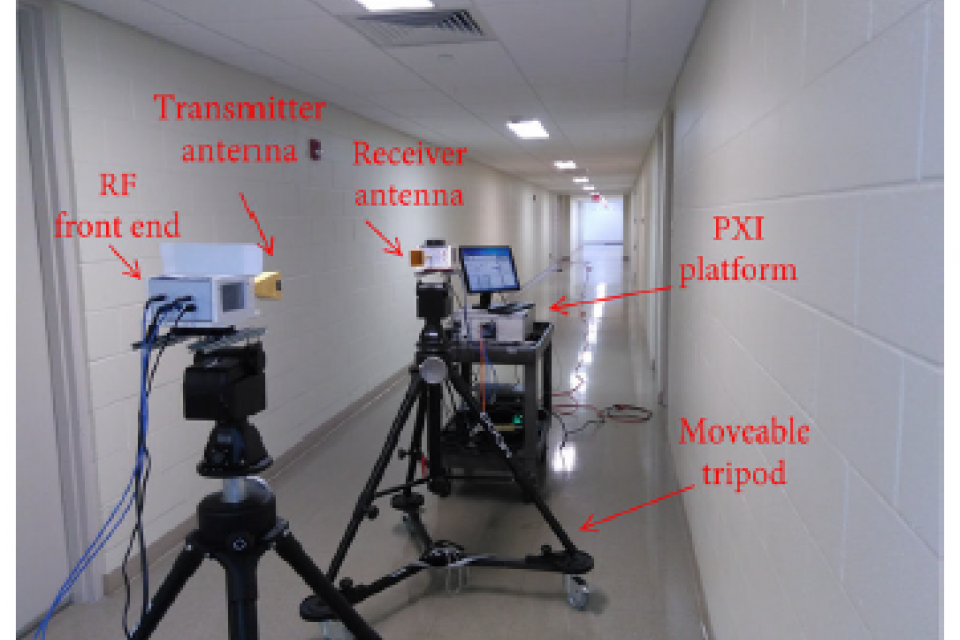
The dataset is divided into two parts. The measurement dataset and simulation dataset. The measurement dataset contains received power measurements at 28 GHz in an indoor corridor and outdoor open area. The received power and other channel statistics, e.g., root mean square delay spread, power and time of arrival of multipath components, and path loss were obtained using the PXI channel sounder system. Two different gain antennas 17 dBi and 23 dBi were used. The transmitter was fixed, whereas the receiver was moved in a straight line aligned to the boresight of the transmitter antenna. Simulations of the measurement scenario were also carried out using the Wireless InSite ray-tracing software.
The measurements were carried out at the North Carolina State University in 2018-19. The indoor measurements were taken at the basement corridor of the Electrical and Computer Engineering Department building. The outdoor measurements were taken at the rooftop of the parking lot building. The measurement dataset contains the raw impulse responses captured continuously during the measurements. The continuous captured impulse response was timestamped based on receiver positions. The raw impulse responses and other channel statistics are provided in the Excel sheets. Each column of the excel sheet is labeled according to the channel statistic stored, e.g., max channel impulse response (CIR), path loss, and root mean square delay spread. The received power after coherently averaging the contribution from different paths at the receiver positions is provided in the .mat files.
Two different gain antennas 17 dBi and 23 dBi were used. There were two polarization pairs namely VV and HH used for measurements. The operating frequency was 28 GHz and the bandwidth of the system was 2 GHz. The duration of the sounding signal was 1.33 µs, which is the maximum measurable excess delay, and a delay resolution of 0.65 ns. The analog to digital converter had a dynamic range of 60 dB and a path loss of up to 185 dB can be measured. The transmit power was set to 0 dBm. The transmitter and receiver were synchronized using identical Rubidium clocks. The Rubidium clock system provided a common 10 MHz clock and pulse per second (PPS) signal.
Ray-tracing simulations of the measurement scenario were also carried out using Wireless InSite software. The ray-tracing simulation dataset is provided in the .txt files. The format of the data in the .txt files is as follows: The first column contains the receiver number, the columns from two to four represent the x, y, and z coordinates of the receiver, the distance (in m) are at the fifth column, the received power (in dBm) is at the sixth column, and the seventh column contains the phase.
Further details of the measurement and simulation setup are provided in the following papers:
- W. Khawaja, , O. Ozdemir, F. Erden, E. Ozturk, and I. Guvenc, ”Multiple ray received power modelling for mmWave indoor and outdoor scenarios” in IET Microwaves, Antennas & Propagation, vol. 14, pp.1825-1836, 2020.
- W. Khawaja, O. Ozdemir, Y. Yapici, F. Erden and I. Guvenc, ”Coverage Enhancement for NLOS mmWave Links Using Passive Reflectors,” in IEEE Open Journal of the Communs. Society, vol. 1, pp. 263-281, 2020. 3 Acknowledgement This work was supported by NASA through the Federal Award under Grant NNX17AJ94A.
##########
Acknowledgement:
This work was supported by NASA through the Federal Award under Grant NNX17AJ94A.


Comments
Contact me if there are any queries about the data and code.