Datasets
Standard Dataset
Experimental (raw) Data of Statistical Comparison Between Formal and Simulated Models’ Outcomes for CIBI vs. CVP General Problem
- Citation Author(s):
- Submitted by:
- Chris Karanikolas
- Last updated:
- Sat, 05/09/2020 - 19:32
- DOI:
- 10.21227/8863-mt73
- Data Format:
- Links:
- License:
 180 Views
- Categories:
- Keywords:
Abstract
Data corresponds to quantitative (raw) effort assessments/predictions during maintenance process of a sample of 1000 possible instances of the general selection problem among Visitor and Inheritance Based Implementation over the Composite design patterns (CIBI vs CVP).
Related values correspond to deterministic results of effort predictions returned by the equations of Formal Model (FM) and stochastic results of effort predictions returned by the Simulation Model (SM), for different 'lamda' values (number of scenario applications) and for all simulation states of the source study entitled "Modeling Software Evolution to Support Early Decision-making among Design Alternatives towards Maintainability"
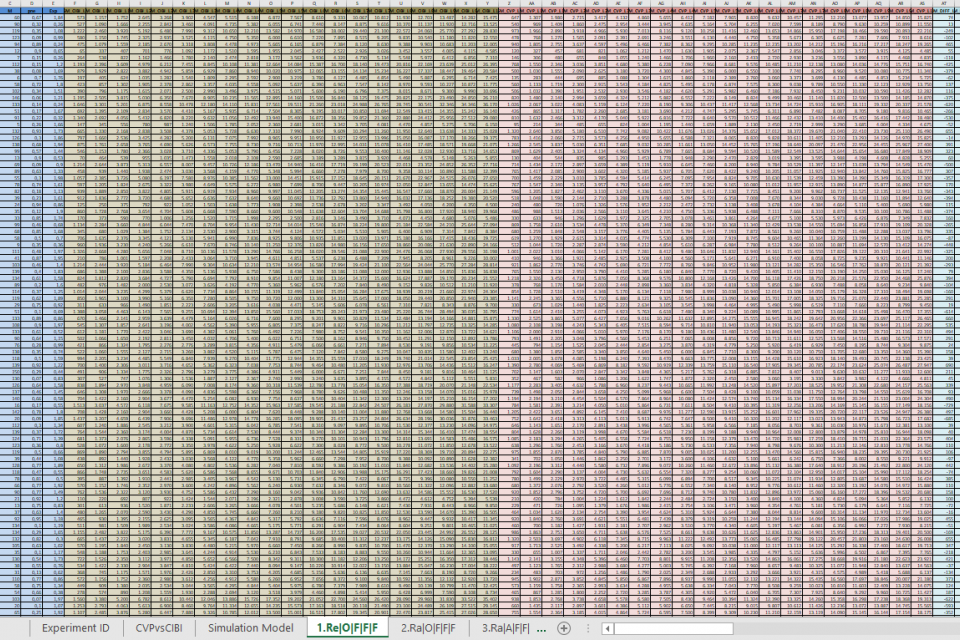
All the numerical values of the experiment/simulation process are provided in a a single .xlsx file, organized per simulation state on 8 separate sheets
Further analysis and statistical techniques can be easily implemented using the provided (raw) data to extract or reveal alternate evidence and reach new conclusions
In each sheet, columns are related to:
A: number of samples instance which corresponds to a specific system
B,C, D, E: values of distinct design attributes, scenario probability, and developers' experience level of the specific instance/system
F to Y: values of the Simulation Model (SM) for different 'lamda' values (number of scenarios' applications 5,10, .. 95, 100), concerning CIBI design combination
Z to AS: values of the Simulation Model (SM) for different 'lamda' values (number of scenarios' applications 5,10, .. 95, 100), concerning CVP design combination
AT to BM: values of the Simulation Model (SM) for different 'lamda' values (number of scenarios' applications 5,10, .. 95, 100), concerning the differnce of CVP-CIBI design combination
BN to CG: values of the Formal Model (FM) for different 'lamda' values (number of scenarios' applications 5,10, .. 95, 100), concerning CIBI design combination
CH to DA: values of the Formal Model (FM) for different 'lamda' values (number of scenarios' applications 5,10, .. 95, 100), concerning CVP design combination
DB to DU: values of the Formal Model (FM) for different 'lamda' values (number of scenarios' applications 5,10, .. 95, 100), concerning the differnce of CVP-CIBI design combination
DV to EO: values of error rate assessments (indicated by different signs among FM and SM related values concerning the difference of CVP-CIBI) after repeated executions of the SM for the same instance/system
Each sheet is related to different simulation state:
1: Deterministic results (no stochastic or random behavior)
2: Engagement of random sequences of scenarios' implementation
3: Engagement of alternate maintenance scenarios
4: Engagement of actual/fluctuating intervention's code size
5: Engagement of fixed developers' experience level and codes aging issues
6. Engagement of increased developers' experience level
7. Engagement of normal distributed developers' experience level
8. Engagement of left-skewed normal distributed developers' experience level
Scope of experiment:
-Analyze the FM of the CIBI vs CVP example problem
-for the purpose of validation, and thus the evaluation of the introduced theory and Modeling Methodology
-with respect to their reliability in terms of accurate effort predictions and thus valid decisions/selections among implementations alternatives
-from the point of view of the software engineer (researcher)
-in the context of the researcher effort to develop and execute a SM that imitates s/w actual maintenance process and returns effort computations, for a random sample of systems (software design attributes and scenario probabilities), in a computer lab, while the computed effort outcomes are compared to FM effort predictions.
Sample size: 1000 randomly selected observations (design attributes and developers experience level)
Output: (Direct) Formal Model predictions, Simulation Model computations of effort/size assessments, and Error rate assessments for each experiment scenario of the sample and for eight different SM states
Output size: 1,120,000 values


