Datasets
Standard Dataset
Three-Phase Flow Facility
- Citation Author(s):
- Submitted by:
- Xiangrui Zhang
- Last updated:
- Sun, 12/22/2024 - 08:28
- DOI:
- 10.21227/0b7j-q780
- License:
 301 Views
- Categories:
- Keywords:
Abstract
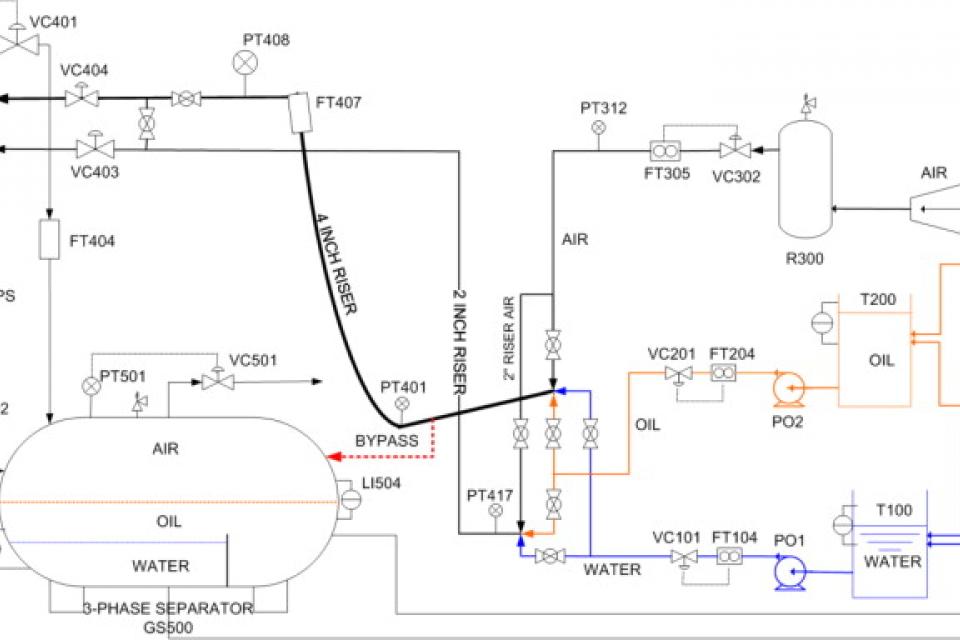
Dateset of the Three-Phase Flow Facility. The Three-phase Flow Facility at Cranfield University is designed to provide a controlled and measured flow rate of water, oil and air to a pressurized system. Fig. 1 shows a simplified sketch of the facility. The test area consists of pipelines with different bore sizes and geometries, and a gas and liquid two-phase separator (0.5 m diameter and 1.2 m high) at the top of a 10.5 m high platform. It can be supplied with single phase of air, water and oil, or a mixture of those fluids, at required rates. Finally the fluid mixtures are separated in an 11 m3 horizontal three-phase separator at ground level (GS500). The air is returned to the atmosphere and the emulsions of oil and water are separated in their respective coalescers (CW500 and CO500, both having a capacity of 1.5 m3 approximately) before returning to their respective storage tanks (T200 and T100). The capacity of both storage tanks is approximately 12.5 m3.
[1] Ruiz-Cárcel, Cristobal, et al. "Statistical process monitoring of a multiphase flow facility." Control Engineering Practice 42 (2015): 74-88.
This is the dataset of the Three-Phase Flow Facility. It is a public benchmark for industrial process monitoring, soft sensor modeling, fault diagnosis.
In addition to the training data sets, different sets of data were acquired from the system working in faulty conditions after seeding six different faults into the system. These faults were used in order to simulate typical malfunctions that could be experienced in a real system such as blockages in the pipelines, wrong system operation or abnormal operating conditions. The faults were introduced after a certain time of normal operation in order to investigate changes in the health indicators. These faults were introduced gradually when possible, in order to observe how the severity of the fault affects the indicator. After reaching a certain level of severity the fault condition was removed, returning the system to normal conditions. Details about the fault start time and fault end time for the different data sets can be found in the description of the corresponding fault scenario. During these tests the flow rate conditions were changed in a similar way as was undertaken for normal operation. There are additional data sets acquired under constant flow rate conditions which allow the observation of the fault effects on the different measured variables without disturbances created by changes in the air and water flow rates. Table 3 summarizes the different faults tested. Each one of the subsections explains how a fault was introduced together with details about the duration of the data sets, flow rate conditions and the instants when faults were introduced or removed, which are summarized in tables.
More from this Author


