Datasets
Standard Dataset
Frequency Domain Dielectric Spectrum Characteristic Parameters and Water Balance Curve Characteristic Parameters of Oil-Paper Insulation
- Citation Author(s):
- Submitted by:
- Tiantian Zou
- Last updated:
- Tue, 05/17/2022 - 22:17
- DOI:
- 10.21227/dq5f-bf90
- Research Article Link:
- License:
 396 Views
- Categories:
- Keywords:
Abstract
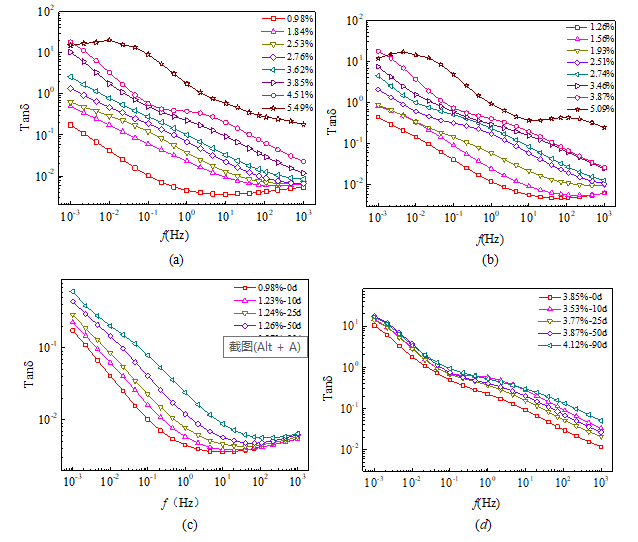
It gives the test results of a few typical samples to analyze the difference in the effect of moisture and aging on FDS curves. (a) and (b) take A1 and A4 samples as examples, respectively, to show the effect of moisture on frequency domain dielectric spectra. It can be seen that the frequency-domain response curves of dielectric loss increase with increase in the moisture content for both unaged and severely aged samples, and there is a difference of nearly two orders of magnitude between dry samples and severely damped samples. (c) and (d) show the effect of aging degree on the FDS curve. It can be seen that the effect of aging on dielectric loss spectra is much smaller than that of water. In contrast, for drier samples (c), aging can also increase dielectric loss, while for wetter samples (d), the effect of aging on dielectric loss becomes very weak and difficult to identify.
These data give the characteristic parameters of dielectric spectrum in frequency domain, through which the corresponding FDS curves can be drawn, as shown in the picture provided.The influence of aging and dampness on oil-paper insulation can be seen preliminarily by comparing and analyzing the curves.


