Moisture Equilibrium Curves
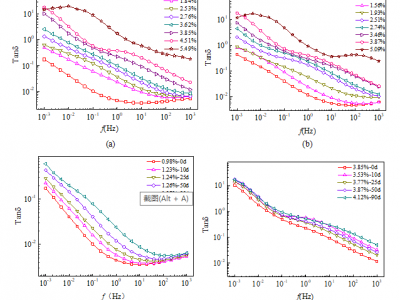
It gives the test results of a few typical samples to analyze the difference in the effect of moisture and aging on FDS curves. (a) and (b) take A1 and A4 samples as examples, respectively, to show the effect of moisture on frequency domain dielectric spectra. It can be seen that the frequency-domain response curves of dielectric loss increase with increase in the moisture content for both unaged and severely aged samples, and there is a difference of nearly two orders of magnitude between dry samples and severely damped samples.
- Categories:
 396 Views