Scattered Field Measurements for Subsequent Compressive Phaseless Imaging Processing
- Citation Author(s):
-
Alejandro del Hoyo
 (Universidad de Oviedo)
Yuri Álvarez-López
(Universidad de Oviedo)
Jaime Laviada
(Universidad de Oviedo)
Fernando Las-Heras
(Universidad de Oviedo)
(Universidad de Oviedo)
Yuri Álvarez-López
(Universidad de Oviedo)
Jaime Laviada
(Universidad de Oviedo)
Fernando Las-Heras
(Universidad de Oviedo)
- Submitted by:
- Alejandro del Hoyo Vijande
- Last updated:
- DOI:
- 10.21227/xpv3-e086
- Data Format:
 205 views
- Categories:
- Keywords:
Abstract
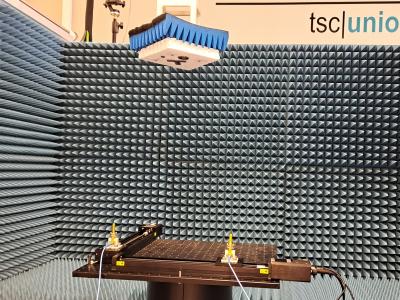
The present contribution consists of two files. The first one (measurements_25GHz_11planes.mat) contains a series of measurements of the scattered electric field using two two-dimensional objects made of aluminum foil as targets. The dataset consists of S21 paramenter measurements, captured with a VNA at a frequency of 25 GHz. The field was sampled in 11 planes located at different distances from the plane containing the objects under test. In each of the planes, the scattered field was sampled forming a grid of 101x101 points, for a total of 10201 measurements along a square of 50 cm per side. The second file (measurement_data_representation.m) is a Matlab program that imports the measurements and graphically represents the magnitude and phase of the scattered field in each plane. Subsequently, the user can input the number of the plane to use to generate a SAR (Synthetic Aperture Radar) image of the objects under test. The ultimate goal of the dataset is to exploit the measurements in the different planes to explore the possibility of using various techniques to obtain a similar image from amplitude-only measurements.
Instructions:
To visualize the measurements of the scattered field in each of the 11 planes, simply execute the program "measurement_data_representation.m" from Matlab IDE. By doing so, two figures will be generated showing the magnitude and phase of the field in each of the measurement planes. Next, the user will be prompted to input the plane number (between 1 and 11) to be used for SAR processing. Finally, a third figure will display the SAR image generated from the measurements of the selected plane. This program only intends to display an image using the dataset measurements, which is available to any other user and can be processed in any other way.