AndalUnmixingRGB: A dataset of Sentinel-2 RGB imagery acquired in Andalusia region of Spain, enriched with environmental ancillary data and annotated for blind Spectral Unmixing using Deep Learning (License CC BY 4.0)
- Citation Author(s):
-
Yassir Benhammou
(Department of Computer Science and Artificial Intelligence, University of Granada, 18071, Granada, Spain. LifeWatch-ERIC ICT Core, 41071, Seville, Spain)
José Rodríguez-Ortega(Department of Computer Science and Artificial Intelligence, University of Granada, 18071, Granada, Spain. LifeWatch-ERIC ICT Core, 41071, Seville, Spain)
- Submitted by:
- Yassir Benhammou
- Last updated:
- DOI:
- 10.21227/y355-9h30
- Data Format:
 262 views
- Categories:
- Keywords:
Abstract
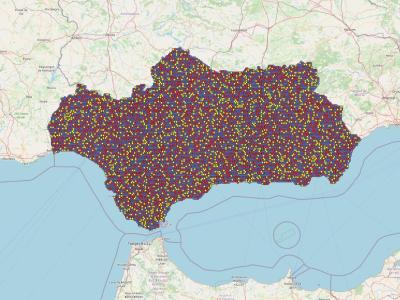
AndalUnmixingRGB is a Sentinel-2 satellite digital RGB imagery enriched with environmental ancillary data and designed for blind spectral unmixing using deep learning. Generally, spectral unmixing involves two main tasks: spectral signature identification of different available land use/cover types in the analyzed hyperspectral or multispectral imagery (endmember identification task) and their respective proportions measurement (abundance estimation task). However, hyperspectral or multispectral images are more expensive, harder to obtain and require more processing effort than their RGB counterpart. To overcome this need, we introduce this dataset, which constitutes to our knowledge the first deep-learning-ready dataset allowing to elaborate spectral unmixing objectives using affordable RGB imagery enriched with its environmental ancillary data without the need to extract hyperspectral or multispectral data. The v1.0 of this dataset contains 21,489 images in JPEG format corresponding to unique 2240x2240m2 tiles covering all the region of Andalusia in Spain. In fact, Each image has 224 x 224 pixels at 10m spatial resolution and was produced by assigning the 25th percentile of all available observations in the Sentinel-2 collection between June 2015 and October 2020 with the aim to diminish atmospheric effects (i.e., clouds, aerosols, shadows, snow, etc.). Each image in this dataset contains land use/cover types abundance values within its corresponding tile at two different annotation levels (N1 and N2), in addition to topographic and climatic ancillary data gathered inside that same area.
Instructions:
The provided annotation in this dataset for spectral unmixing is organized into two levels reflecting two LULC levels definitions. The first Level "N1" contains four high level LULC classes, whereas the second level "N2" contains ten finer LULC classes. Both annotation levels values were extracted from the SIPNA LULC mapping campaign which aims to build an Information System on the Natural Heritage of Andalusia in Spain. For each 2240x2240m2 tile in Andalusia, we used its center coordinates to extract the Sentinel-2 true color RGB image covering its corresponding 2240x2240 m2 area. As a source product, we opted for "Sentinel-2 MSI (Multi-Spectral Instrument)" since it is free and publicly available in Google Earth Engine (GEE) at the fine resolution of 10m. We used "Level-1C" (i.e., top-of-atmosphere reflectance) since it provides the longest data availability of Sentinel-2 images without any modification of the data. Every image was built as a temporal aggregation of its image collection gathered between June 2015 and October 2020. During this aggregation, we considered only the highest quality images. First, we discarded all image instances where the cloud probability exceeded 20% according to the metadata provided in their corresponding Sentinel-2 collection. Then, we calculated the 25th-percentile value between all remaining images for each reflectance band (R, G, and B), and built the final image with the obtained 25-percentile values for each pixel in its RGB bands. The three obtained bands (B4, B3, and B2) required a saturation mapping of their reflectance values into 0-255 RGB digital values. Thus, we mapped the saturation reflectance of 3558 into 255 to obtain true RGB channels with digital values between 0 and 255. The choice of these mapping numbers was based on the Sentinel-2 true colour image recommendations section available in Sentinel user guidelines.
To enhance the informative value of these RGB images, we computed for each image, 7 distinct ancillary data that can be categorized into 2 environmental data types. The fist type consists of climatic data that includes evapotranspiration, precipitation, average, maximum and minimum temperature. To compute these values, we used data available in REDIAM (Environmental Information Network of Andalusia) which provided us with climatic data for the year 2020 that corresponds to the year of the adopted RGB images annotations. To get the average temperature for each tile, we computed its mean value of the monthly average temperature measured during 2020. Similarly, for the minimum and maximum temperatures, we computed the mean value over the 12 minimum and maximum temperature values registered monthly during 2020. Regarding evapotranspiration and precipitation, we accumulated the 12 monthly measured values of 2020. The second type of collected ancillary data consists of topographic elevation and slop data computed for each 2240x2240m2 tile in our dataset using Google Earth Engine pre-defined functions dedicated to these computations.
This dataset is stored as 2 main zip-compressed folders :
The first folder called "RGB Sentinel-2 images Andalucia.zip" that contains all RGB images available in the dataset. Each image filename is formatted as follow "Class_N1 dominant class ID_ID_Tile ID_Purity_N1 dominant class abundance value__(Latitud,Longitud).jpg". Where: "N1 dominant class ID" and "N1 dominant class abundance value" represent the dominant class id and its abundance percentage in that image at level N1; "Tile ID" corresponds to the attributed integer ID to that image tile among all available tiles in Andalusia; "Latitud" and "Longitud" represent the center coordinates of that image tile.
The second folder called "CSV annotation + ancillary data.zip" that contains the required annotations to elaborate spectral unmixing tasks in addition to the gathered environmental ancillary data. Practically, it consists of two distinct csv files, one for N1 annotations called "CSV_N1_annotations_ancillary_partition.csv" and another one for N2 annotations called "CSV_N2_annotations_ancillary_partition.csv". These annotations are basically land use/cover types abundances that are represented as a coverage portion (between 0 and 1) of each class in that level in regards to the whole image tile surface. "CSV_N1_annotations_ancillary_partition.csv" and "CSV_N1_annotations_ancillary_partition.csv" has the same following 12 columns in both CSVs:
- square_id: the attributed integer to that image tile among all available tiles in Andalusia
- filename: the image full filename
- Class_max: the dominant class id at the considered annotation level among all mixed classes available in the image
- Value_max: the dominant class abundance value at the considered annotation level in the image
- evapotranspiration: the gathered evapotranspiration value gathered inside the image during the considered period
- precipitation: the gathered precipitation value gathered inside the image during the considered period
- temp_ave: the gathered average temperature value gathered inside the image during the considered period
- temp_max: the gathered maximum temperature value gathered inside the image during the considered period
- temps_min: the gathered minimum temperature value gathered inside the image during the considered period
- elevation: the gathered elevation value gathered inside the image
- slope: the gathered slope value gathered inside the image
- partition: the partition (training or validation or test) that this image is used for in the experimental setup related to the use of this dataset for training deep learning models with the aim of elaborating blind spectral unmixing
Whereas the other annotation columns proper to each level csv file (N1 and N2) are different. In fact, N1 CSV file contains the following 4 other columns (1, 2, 4, 5) that contain respectively the abundance values of these N1 classes in each image. Similarly, N2 CSV file contains the following 10 other columns (1, 21, 22, 23, 31, 35, 41, 42, 47, 51) that correspond respectively to the abundance values of these N2 classes in each image.
In addition, we provided an Excel file called "N1 and N2 Classes Dictionnary.xlsx" containing a dictionary mapping each land use/cover class ID in N1 or N2 annotation levels to its corresponding description. This Excel file contains two excel sheets, where each one corresponds to an annotation level.


