VinUni Canopy Height Dataset - Cuc Phuong
- Citation Author(s):
-
Duc Anh Vu
- Submitted by:
- Anh Vu
- Last updated:
- DOI:
- 10.21227/mf73-rz62
 279 views
- Categories:
- Keywords:
Abstract
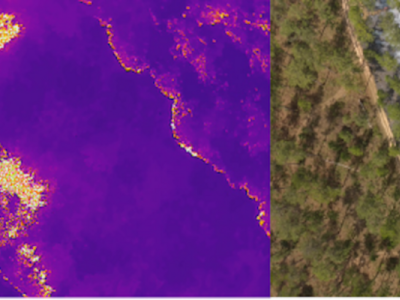
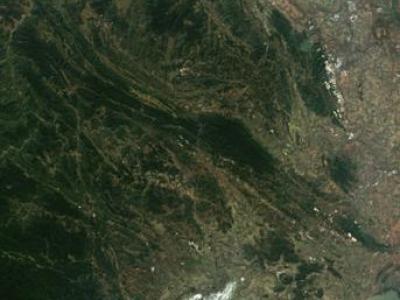
The dataset used in this study combines remote sensing data from multiple advanced platforms, including Synthetic Aperture Radar (SAR) from Sentinel-1, multispectral imagery from Sentinel-2, and LiDAR measurements from the Global Ecosystem Dynamics Investigation (GEDI) mission. Each of these sources offers unique and complementary information, enabling a detailed and comprehensive analysis of forest canopy height across diverse and ecologically significant regions in northern Vietnam. These regions include Cuc Phuong - Pu Luong, which were selected for its distinctive forest types and topographical complexity. In this study, the Sentinel-1 data were used to capture surface characteristics, including texture and structural features of vegetation, through its VV and VH polarization bands. Sentinel-2 imagery provided detailed spectral information across 12 bands, covering visible, near-infrared (NIR), and shortwave infrared (SWIR) wavelengths. Meanwhile, the GEDI LiDAR data, with its unparalleled resolution and density, offered precise measurements of canopy height and profiles, serving as the reference standard for model training and validation. This multi-source dataset provides a robust and large-scale representation of Vietnam’s forest ecosystems, enabling the study to address challenges in canopy height estimation across diverse terrains and ecological contexts. By leveraging the complementary strengths of SAR, multispectral, and LiDAR data, the dataset serves as a foundation for training and developing deep learning models, which can subsequently be used to create large-scale canopy height maps.
Instructions:
The data processing steps include the following: 1. Aggregate GEDI data from .h5 files. 2. Process Sentinel-2 data. 3. Align GEDI and Sentinel data. 4. Merge 12 Sentinel-2 bands and 2 Sentinel-1 bands. 5. Calculate mean and variance. 6. Initialize the HDF5 file and split the data into training and testing sets. 7. Save the processed data to a file.


