Sub-Gigahertz Spectrum Survey
- Citation Author(s):
-
Rodney Martinez Alonso
 (KU LEUVEN)
David Plets
(Ghent University)
Sofie Pollin
(KU Leuven)
Luc Martens
(Ghent University)
Wout Joseph
(Ghent University)
(KU LEUVEN)
David Plets
(Ghent University)
Sofie Pollin
(KU Leuven)
Luc Martens
(Ghent University)
Wout Joseph
(Ghent University)
- Submitted by:
- Rodney Martinez Alonso
- Last updated:
- DOI:
- 10.21227/fv00-ws43
- Data Format:
- Research Article Link:
 157 views
- Categories:
- Keywords:
Abstract
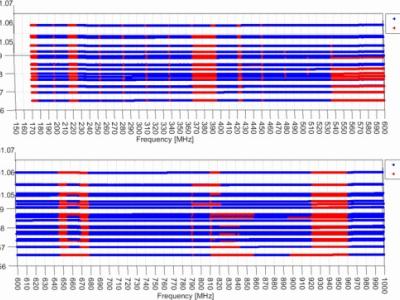
The dataset comprises the spectral density peak power levels from a spectrum survey in a rural area of Belgium. For the spectrum measurements we consider 21 locations of a rural scenario in Nevele, Belgium. This is a mostly flat area with detached isolated houses and farms. We defined a grid of different locations for measuring the peak signal levels [dBm] across the spectrum between 170 MHz and 1000 MHz, during a period of 0.5 h. The measurements across the different locations are not synchronized and, therefore not correlated in the time domain. The maximum signal fading recorded during the time of the measurements was approximately 5 dB. Therefore, at each measurement location, we account for the 99th-percentile of the signal levels through time. This is done to account for the maximum levels and remove the temporal variations caused by fading.
Instructions:
The file N2_Geoloc.xlsx include the geolocation of each measurement site, and a numeric identifier corresponding to the measurement CSV files e.g., ID 1 --> Site 1 --> Measurment file 1.csv.
Each Measurement CSV file contains two columns, one with a frequency [Hz] (resolution of approximately 0.68 MHz) and the second column with the 99th percentile maximum power level [dBm]. The Measurment CSV file are splitter in 2 sub-bands: a) denotes the measurements from 170 MHz to 600 MHz and b) the measurements from 600 MHz to 1 GHz.