Datasets
Standard Dataset
SAR Simulation for powerlines
- Citation Author(s):
- Submitted by:
- Sijie Ma
- Last updated:
- Sun, 09/08/2024 - 06:15
- DOI:
- 10.21227/zktx-mc27
- Data Format:
- Research Article Link:
- Links:
- License:
 322 Views
- Categories:
- Keywords:
Abstract
The analysis of complex scattering patterns in SAR images of high-voltage power lines is important to comprehend the multi-reflection effects of these cylindrical shape structures. Such insights are invaluable for applications related to inspection management, particularly in safety analysis and ongoing monitoring. This paper introduces a novel point scattering tracing method to dissect the intricate multi-reflection effects of power lines in high-resolution X-band SAR data. The paths of multi-reflection events at the power lines are delineated through a proposed model, which leverages LiDAR point cloud data and SAR system parameters with subpixel precision. Under the condition of a parallel tangent line to the azimuth direction, the proposed quadratic polynomial model is solvable to pinpoint the centers of the single- and triple-reflection point signatures of power lines in SAR coordinate. Analysis of time series SAR images reveals the activation of the double- and triple-reflection effects induced by water ripples or swinging lines, which is challenging to quantify. The proposed mathematical model is validated through testing with TerraSAR-X data in two distinct cases, and the results are highly consistent. The new insights of both visible and invisible components of the double and triple reflections of power lines introduce new challenges to SAR research.
Step 1: Calculating the Right Position of Points on SAR Imagery
1. Locate the Point Cloud Data:
Find the point cloud data files in the ../Lidar/ directory. For instance, A.txt contains the data for Line A.
2. Control Scattering Simulations:
The text files in the ../Lidar/ directory (e.g., *.txt) can be used to specify the number of scattering simulations: single, double, or triple.
3. Run the Shell Script:
Use the Calculate-Multi-Lidar-SARpixel.sh script to process the point cloud data and simulate multi-scattering. The script requires specific parameters which should be provided based on the hints displayed on your screen.
Command example (parameters need to be adapted to your specific needs):
./Calculate-Multi-Lidar-SARpixel.sh [parameters]
4. Resulting Files:
After running the script, directories will be created for different scattering types:
Single/ for single scattering results
Double/ for double scattering results
Triple/ for triple scattering results
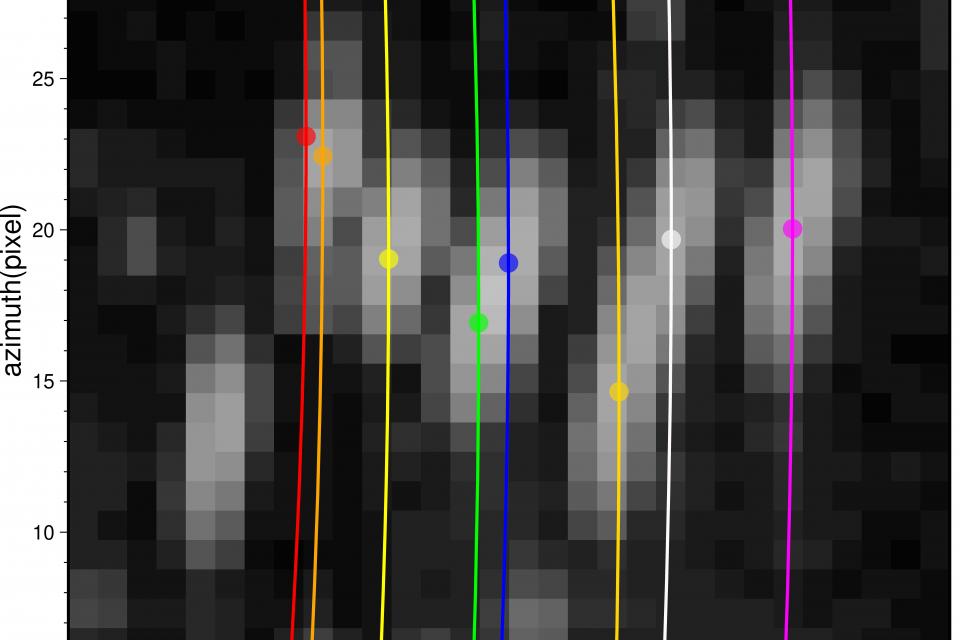
Step 2: Plotting the Simulated Power Lines on SAR Imagery
1. Prepare to Plot:
You will use the gmt-MLI-AOI-point-draw-all.sh script for visualizing the results. This script is built upon:
gmt-MLI-AOI-point-draw.sh for plotting basic points
gmt-MLI-AOI-Simulation-draw.sh for plotting simulation points and scattering spots
2. Simulate Scattering Spot Centers:
Use gmt-MLI-AOI-Simulation-draw.sh to choose the centers of scattering spots for accurate power line simulation.
Also with the Simulation.py in your document.
3. Run the Shell Script:
Execute the gmt-MLI-AOI-point-draw.sh script to visualize the power lines on SAR imagery. Ensure to provide the correct parameters as indicated by your screen prompts.
Command example (parameters need to be adapted to your specific needs):
./gmt-MLI-AOI-point-draw.sh [parameters]
4. Custom Plotting:
If required, use the Simulation.py Python script to generate and fine-tune the positions of the scattering spots.
Step 3: Data Overview
Please note that due to licensing restrictions, only images of the region (.mli) are displayed for the files.
If you need the mli dataset, please contact Prof. Mahdi Motagh:
at the Section of Remote Sensing and Geoinformatics, GFZ German Research Centre for Geosciences, Potsdam, 14473, Germany,
and also at the Institute of Photogrammetry and Geoinformation, Leibniz University Hannover, Hannover, 30167, Germany.
(e-mail: motagh@gfz-potsdam.de).
[1] TSXE: YZH Area
Directory: TSXE/MLI/yymmdd/
Contains: .mli files and LiDAR points for power line simulations.
Examples:
20240101-03 for three case studies.
20240102 for Case II.
[2] TSXasc: BD Area (Ascending Data)
Data Structure: Similar to TSXE.
Water Level Consideration: Fluctuates between 145 m and 175 m. Check TSXasc/Water/ for detailed information.
[3] TSXdes: BD Area (Descending Data)
Data Structure: Similar to TSXasc.
Noteworthy Dates:
20231214 for average MLI of all datasets.
20231219 and 20231220 for high and low water level simulations, respectively.
Summary
Calculate Scattering Points: Use Calculate-Multi-Lidar-SARpixel.sh to simulate scattering and obtain results in different directories.
Plot the Results: Use gmt-MLI-AOI-point-draw-all.sh and related scripts for visualizing the simulated power lines on SAR imagery.
Review Data: Use the provided dataset directories (TSXE, TSXasc, TSXdes) for accurate simulations and analysis.
Documentation
| Attachment | Size |
|---|---|
| 3.09 KB |


