Datasets
Standard Dataset
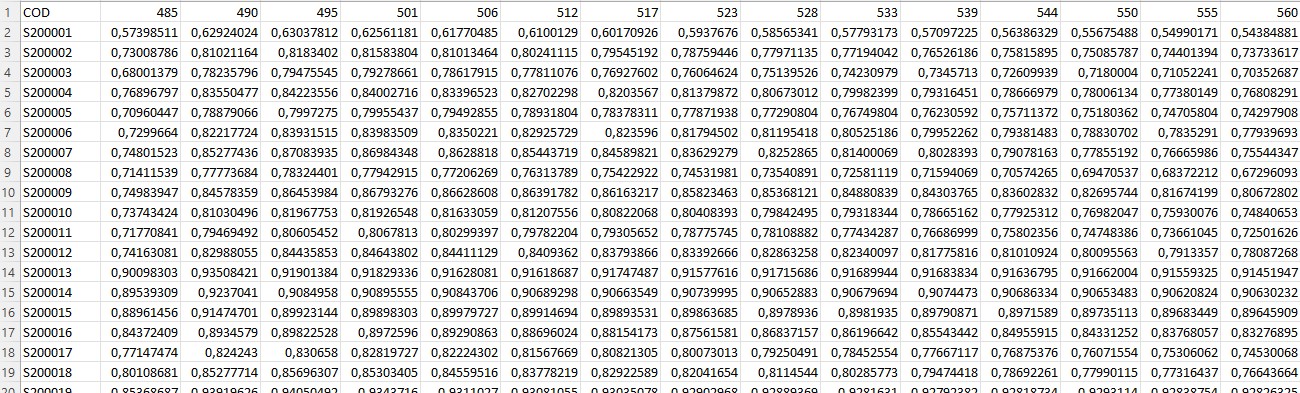
Reflectance and wet chemistry values
- Citation Author(s):
- Submitted by:
- Manuela Ortega
- Last updated:
- Mon, 07/08/2024 - 15:58
- DOI:
- 10.21227/b19p-wb70
- License:
 38 Views
- Categories:
- Keywords:
Abstract
El carbono orgánico (OC) y el nitrógeno total (N) son
Nutrientes sensibles para el crecimiento de las plantas. La presencia de estos nutrientesEl carbono orgánico (OC) y el nitrógeno total (N) sonOrganic carbon (OC) and total nitrogen (N) are es-Organic carbon (OC) and total nitrogen (N) are sential nutrients for plant growth. The presence of these nutrierganic carbon (OC) and total nitrogen (N) are ews-
w
sential nutrients for plant growth. The presence of these nutrients
in acceptable quantities can generate an optimal environment for
the development of crops of interest. The application of statistical
machinelearningalgorithmsandsensorsinagriculturehas
enabled the calibration of models that can predict the amounts
of elements in soil. Hyperspectral imaging captures portions
of the electromagnetic spectrum , enabling differentiation of
materialspresentinsoil.Theobjectiveofthisresearchis
tovalidatestatisticalmodelstopredictOCandNinsoils
from hyperspectral images. Transformations were applied to the
spectral data. Random forest (RF) and support vector machine
(SVM) models. The values of the coefficient of determination
(R2), the root-mean-square error of prediction (RMSEP), and
the ratio performance deviation (RPD) were considered. For the
OC, the values found for the RF model were an R2 of 0.87,
RMSEP of 0.10, and an RPD of 6.74; the results for the SVM
model were an R2 of 0.92, RMSEP of 0.20, and an RPD of 3.56.
For N, the values found for the RF model were an R2 of 0.79,
RMSEP of 0.03, and an RPD of 5.44; the results obtained with
SVM model were an R2 of 0.87, RMSEP of 0.08, and an RPD
of 2.76. The RF models showed larger adjustments for the two
variables. The SVM model also generated acceptable results. The
results show that machine learning models are a good alternative
for analyzing variables related to soilin acceptable quantities can generate an optimal environment for
the development of crops of interest. The application of statistical
machinelearningalgorithmsandsensorsinagriculturehas
enabled the calibration of models that can predict the amounts
of elements in soil. Hyperspectral imaging captures portions
of the electromagnetic spectrum , enabling differentiation of
materialspresentinsoil.Theobjectiveofthisresearchis
tovalidatestatisticalmodelstopredictOCandNinsoils
from hyperspectral images. Transformations were applied to the
spectral data. Random forest (RF) and support vector machine
(SVM) models. The values of the coefficient of determination
(R2), the root-mean-square error of prediction (RMSEP), and
the ratio performance deviation (RPD) were considered. For the
OC, the values found for the RF model were an R2 of 0.87,
RMSEP of 0.10, and an RPD of 6.74; the results for the SVM
model were an R2 of 0.92, RMSEP of 0.20, and an RPD of 3.56.
For N, the values found for the RF model were an R2 of 0.79,
RMSEP of 0.03, and an RPD of 5.44; the results obtained with
SVM model were an R2 of 0.87, RMSEP of 0.08, and an RPD
of 2.76. The RF models showed larger adjustments for the two
variables. The SVM model also generated acceptable results. The
results show that machine learning models are a good alternative
for analyzing variables related to soilsential nutrients for plant growth. The presence of these nutrients
in acceptable quantities can generate an optimal environment for
the development of crops of interest. The application of statistical
machinelearningalgorithmsandsensorsinagriculturehas
enabled the calibration of models that can predict the amounts
of elements in soil. Hyperspectral imaging captures portions
of the electromagnetic spectrum , enabling differentiation of
materialspresentinsoil.Theobjectiveofthisresearchis
tovalidatestatisticalmodelstopredictOCandNinsoils
from hyperspectral images. Transformations were applied to the
spectral data. Random forest (RF) and support vector machine
(SVM) models. The values of the coefficient of determination
(R2), the root-mean-square error of prediction (RMSEP), and
the ratio performance deviation (RPD) were considered. For the
OC, the values found for the RF model were an R2 of 0.87,
RMSEP of 0.10, and an RPD of 6.74; the results for the SVM
model were an R2 of 0.92, RMSEP of 0.20, and an RPD of 3.56.
For N, the values found for the RF model were an R2 of 0.79,
RMSEP of 0.03, and an RPD of 5.44; the results obtained with
SVM model were an R2 of 0.87, RMSEP of 0.08, and an RPD
of 2.76. The RF models showed larger adjustments for the two
variables. The SVM model also generated acceptable results. The
results show that machine learning models are a good alternative
for analyzing variables related to soil
en cantidades aceptables puede generar un entorno óptimo para
el desarrollo de cultivos de interés. La aplicación de la estadística
máquinaaprendizajeAlgoritmosysensoresenagriculturatiene
Permitió la calibración de modelos que pueden predecir las cantidades
de elementos en el suelo. Las imágenes hiperespectrales capturan porciones
del espectro electromagnético , permitiendo la diferenciación de
materialespresenteensuelo.Elobjetivodeésteinvestigaciónes
ParavalidarestadísticomodelosParapredecirOCyNenSuelos
de imágenes hiperespectrales. Las transformaciones se aplicaron a la
datos espectrales. Bosque aleatorio (RF) y máquina de vectores de soporte
(SVM) modelos. Los valores del coeficiente de determinación
(R2), el error de predicción de la raíz cuadrática media (RMSEP), y
se consideraron los ratios de desviación de rendimiento (RPD). Para el
OC, los valores encontrados para el modelo de RF fueron un R2 de 0,87,
RMSEP de 0,10 y un RPD de 6,74; los resultados para la SVM
fueron un R2 de 0.92, RMSEP de 0.20 y un RPD de 3.56.
Para N, los valores encontrados para el modelo de RF fueron un R2 de 0,79,
RMSEP de 0,03 y un RPD de 5,44; los resultados obtenidos con
El modelo SVM fue un R2 de 0.87, RMSEP de 0.08 y un RPD
de 2,76. Los modelos RF mostraron ajustes más grandes para los dos
Variables. El modelo SVM también generó resultados aceptables. El
Los resultados muestran que los modelos de aprendizaje automático son una buena alternativa
para analizar variables relacionadas con el sueloen cantidades aceptables puede generar un entorno óptimo para
el desarrollo de cultivos de interés. La aplicación de la estadística
máquinaaprendizajeAlgoritmosysensoresenagriculturatiene
Permitió la calibración de modelos que pueden predecir las cantidades
de elementos en el suelo. Las imágenes hiperespectrales capturan porciones
del espectro electromagnético , permitiendo la diferenciación de
materialespresenteensuelo.Elobjetivodeésteinvestigaciónes
ParavalidarestadísticomodelosParapredecirOCyNenSuelos
de imágenes hiperespectrales. Las transformaciones se aplicaron a la
datos espectrales. Bosque aleatorio (RF) y máquina de vectores de soporte
(SVM) modelos. Los valores del coeficiente de determinación
(R2), el error de predicción de la raíz cuadrática media (RMSEP), y
se consideraron los ratios de desviación de rendimiento (RPD). Para el
OC, los valores encontrados para el modelo de RF fueron un R2 de 0,87,
RMSEP de 0,10 y un RPD de 6,74; los resultados para la SVM
fueron un R2 de 0.92, RMSEP de 0.20 y un RPD de 3.56.
Para N, los valores encontrados para el modelo de RF fueron un R2 de 0,79,
RMSEP de 0,03 y un RPD de 5,44; los resultados obtenidos con
El modelo SVM fue un R2 de 0.87, RMSEP de 0.08 y un RPD
de 2,76. Los modelos RF mostraron ajustes más grandes para los dos
Variables. El modelo SVM también generó resultados aceptables. El
Los resultados muestran que los modelos de aprendizaje automático son una buena alternativa
para analizar variables relacionadas con el suelo
w
Dataset Files
- Absorbance dataset Abs.xlsx (48.63 MB)
- chemistry dataset Resultadosq.xlsx (125.77 kB)


