The influence of M1 and DLPFC iTBS on BCI performance: A TMS and fNIRS study
- Citation Author(s):
-
Qian Ding
- Submitted by:
- Qian Ding
- Last updated:
- DOI:
- 10.21227/pkkk-7w87
 7 views
- Categories:
- Keywords:
Abstract
Many stroke survivors are unable to effectively control brain-computer interface (BCI) devices due to insufficient sensorimotor activity generated during motor imagery. Previous studies focused on upregulating motor cortex excitability and overlooked the important role that motor imagery plays on BCI control. Dorsolateral prefrontal cortex (DLPFC), an important region for motor imagery, may serve as an effective target for improving BCI performance. This study is aimed at investigating how intermittent theta burst stimulation (iTBS) targeted on primary motor cortex (M1) and DLPFC influences BCI performance and its neural mechanisms. Twenty-five healthy subjects received four types of iTBS (i.e., M1 iTBS, DLPFC iTBS, combination of M1 and DLPFC iTBS and sham iTBS) in a random order. BCI control testing, functional near-infrared spectroscopy assessment and single-pulse transcranial magnetic stimulation were performed before and immediately after iTBS in each session. Corticospinal excitability, brain activation, and functional connectivity were calculated. Our results revealed that corticospinal excitability was significantly increased after M1 iTBS (P=0.016), with the magnitude of increase positively correlated with changes in BCI performance (P=0.013). Frontoparietal network functional connectivity was significantly increased after DLPFC iTBS (P’s<0.05), with the magnitude of increase positively correlated with changes in BCI performance (P’s<0.05). In conclusion, M1 iTBS could improve BCI performance via increasing corticospinal excitability, whereas DLPFC iTBS could improve BCI performance via increasing frontoparietal network functional connectivity. These findings may inform the development of new treatment for neurological populations to improve BCI performance and be more engaged in BCI training.
Instructions:
3.1 BCI performance
The ANOVA model revealed a significant main effect of Timepoint [F (1, 24) = 5.13, P =0.03]. The post-hoc analysis did not reveal any significant change after iTBS in any condition (P’s > 0.05).
3.2 MEP amplitude
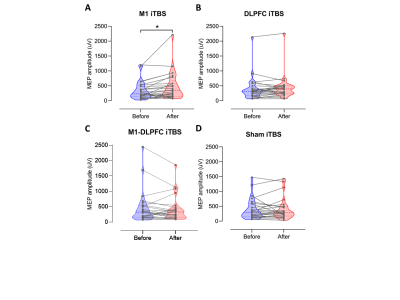
The Wilcoxon Signed Ranks tests revealed that MEP amplitude was significantly increased after M1 iTBS (P = 0.016); while in other condition, MEP amplitude was not changed significantly after iTBS (P’s > 0.05) (Figure 3).
3.3 fNIRS data
3.3.1 Brain activation
In M1 iTBS, the ANOVA model revealed significant main effect of ROI [F (7, 168) = 2.53, P =0.017] and ROI×Timepoint interaction [F (7, 168) = 2.15, P =0.041]. The post-hoc analysis did not reveal any significant change after iTBS in any ROI (P’s > 0.05). In DLPFC iTBS, the ANOVA model did not reveal any significant main effect or interaction.
In M1-DLPFC iTBS, the ANOVA model revealed significant main effect of ROI [F (7, 168) = 2.79, P =0.01]. The post-hoc analysis did not reveal any significant change after iTBS in any ROI (P’s > 0.05). In Sham iTBS, the ANOVA model revealed significant main effect of ROI [F (7, 168) = 2.35, P =0.026] and ROI×Timepoint interaction [F (7, 168) = 2.22, P =0.035]. The post-hoc analysis did not reveal any significant change after iTBS in any ROI (P’s > 0.05).
3.3.2 Functional connectivity
When measuring at rest, in DLPFC iTBS, the ANOVA model revealed significant main effect of ROI [F (27, 648) = 10.5, P <0.001] and Timepoint [F (1, 24) = 9.44, P =0.005]. The post-hoc analysis revealed that L DLPFC-R M1 and L DLPFC-R PPC PLV were significantly increased after iTBS (P’s = 0.007 and 0.023, respectively) (Figure 4). When measuring during motor imagery, in DLPFC iTBS, the ANOVA model revealed significant main effect of ROI [F (27, 648) = 9.79, P <0.001] and ROI×Timepoint interaction [F (27, 648) = 3.07, P < 0.001]. The post-hoc analysis revealed that R DLPFC-R M1, L DLPFC-R PPC PLV were significantly increased after iTBS (P’s = 0.021 and 0.020, respectively). R PPC-R M1 PLV was significantly reduced after iTBS (P = 0.009) (Figure 5). In other conditions, the ANOVA models did not reveal any significant result.
3.4 Correlations
There was a positive correlation between changes in MEP amplitude and changes in BCI performance after M1 iTBS (r = 0.49, P = 0.013). Correlations between the changes in MEP amplitude and BCI performance after iTBS in other conditions did not reach statistical significance (P’s > 0.05) (Figure 6A).
There were positive correlations between changes in L DLPFC-R PMC and L DLPFC-R PPC PLV and changes in BCI performance after DLPFC iTBS (r’s = 0.60 and 0.73, P’s = 0.04 and 0.001, respectively). Correlations between the changes in PLV and BCI performance after iTBS in other conditions did not reach statistical significance (P’s > 0.05) (Figure 6 B-C).