Datasets & Competitions
It is observed from the pattern of Electricity Demand in the months of November 2022 and March 2023 that switchover from Summer Time to Winter Time and vice versa causes a shift in demand pattern corresponding to the time shifts. The hourly electricity demands of US48 states have been shown in separate excel files for November 2022 and March 2023. In sheet 2 of both the excel files, a graphical plot of the average hourly demands in the week before the switchover has been compared with a graphical plot of the average hourly demands in the week after the switchover.
- Categories:
 29 Views
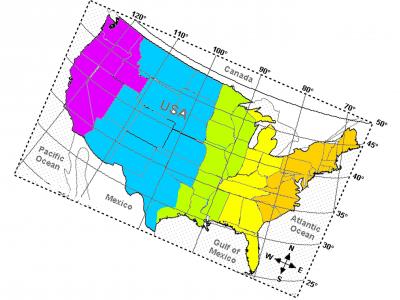
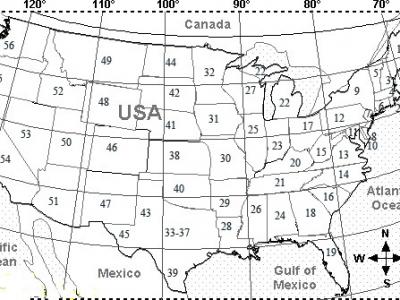
The integrated power grid in USA is the largest in the world with the highest hourly power demand. In 2019, the highest hourly demand was more than 704 GW and the lowest hourly demand was less than 340 GW. The average daily variation in hourly demand is about 40% with respect to the highest hourly demand. A mathematical model is used to reduce the differential between peak and off-peak electrical power demand in this territory. The reduction is achieved with 5 time zones set up across US 48 states such that time difference between Far East and Far west is 4 hours.
- Categories:
 205 Views
