Datasets
Standard Dataset
Trilateration based on RSSI values in transmitters and receivers
- Citation Author(s):
-
JerryLandivar G.
 Escuela Superior Politecnica del LitoralCarolinaOrmaza C.Escuela Superior Politecnica del LitoralVíctorAsanzaEscuela Superior Politecnica del LitoralVerónicaOjeda C.Escuela Superior Politecnica del LitoralJuan CarlosAvilesEscuela Superior Politecnica del Litoral
 - Submitted by:
- Victor Asanza
- Last updated:
- Tue, 08/22/2023 - 21:46
- DOI:
- 10.21227/kjta-6551
- Data Format:
- Research Article Link:
- Links:
- License:
 61318 Views
- Categories:
- Keywords:
Abstract
⭐ When using this resource, please cite the original publication:
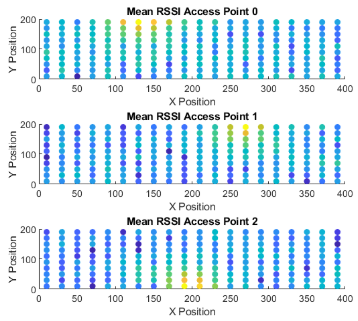
This dataset has received power measurements from three receivers using a mobile transmitter. An area of 4m x 2m was divided into 200 squares. The transmitter was positioned in each grid and 100 measurements of RSSI values received at three fixed receivers were made, as shown in the graph. This dataset has a total of 2000 rows corresponding to 100 examples in each of the 200 grid positions. In addition, the dataset has the following columns:
- Grid: which has values from 1 to 200.
- Position in X: with values from 0 to 4 meters.
- Position in Y: with values from 0 to 2 meters.
- RSSI in receiver 1
- RSSI in receiver 2
- RSSI in receiver 3
Future Work:
- To perform measurements over larger areas
- Increase the number of receivers to improve prediction accuracy
- Use more than one transmitter, to track more objects
The attached document presents the script with which the data is preprocessed, characterized and classified. All this code was developed in matlab.
All source code is available in the following github repository: https://github.com/vasanza/WiFi_RSSI_Localization

Documentation
| Attachment | Size |
|---|---|
| 1.98 MB |


