Datasets
Standard Dataset
ATLASky-AI_4D_Spatiotemporal_Aerospace_Benchmark
- Citation Author(s):
-
RaedAwill
 University Of Derby
 - Submitted by:
- RAED AWILL
- Last updated:
- Thu, 04/10/2025 - 06:27
- DOI:
- 10.21227/vtk4-qn33
- Data Format:
- Research Article Link:
- License:
 83 Views
- Categories:
- Keywords:
Abstract
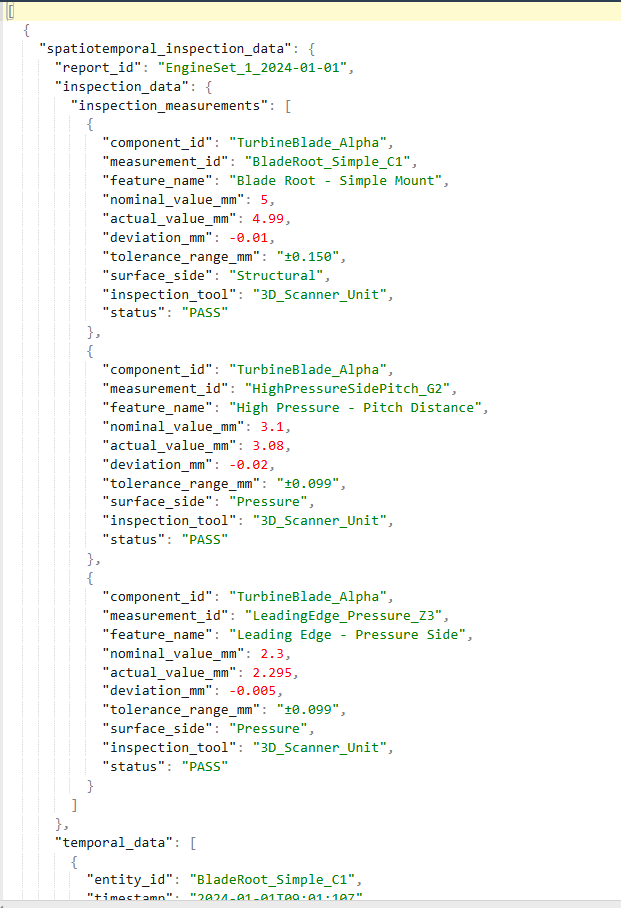
This dataset integrates three distinct aerospace data sources—AddQual turbine-blade inspection reports, CAD-based geometric features, and NASA ASRS aviation incidents—into a unified 4D (X, Y, Z, Time) spatiotemporal format. Using GPT‑4O finetuned on an aerospace data, each domain’s raw text or 3d model was converted into structured JSON, preserving key measurements, relationships, and timestamps. The AddQual portion reflects anonymized but authentically verified dimensional checks by aerospace experts, while CAD and NASA data are publicly sourced and synthetically enhanced for multi-modal consistency. Together, these data streams offer a robust testbed for knowledge graph construction, multi-modal data fusion, and real-time verification pipelines—particularly the ATLASky-AI framework’s Ranked Multi-Modal Verification (RMMVe) and Adaptive Intelligence Cycle (AAIC). By capturing realistic anomalies, partial coordinates, and masked proprietary details, this dataset showcases how next-generation aerospace inspection systems can unify heterogeneous data into a cohesive, verifiable knowledge environment.
Download & Parse
- Acquire the JSON file and load it into your data processing environment (e.g., Python) to access each record.
· Identify Data Type
- Distinguish among AddQual, CAD, and NASA entries by checking the top-level key:
- spatiotemporal_inspection_data (AddQual)
- unified_spatiotemporal_data (CAD)
- spatiotemporal_incident_data (NASA)
· Map to Ontology
- For best results, map each entry’s fields to an aerospace ontology (e.g., part classes, measurement properties, flight phases).
· Verification & Analysis
- Feed the parsed data into your chosen pipeline—e.g., the ATLASky-AI framework with RMMVe—to verify numeric tolerances, missing coordinates, or suspicious entries.
- Leverage the Adaptive Intelligence Cycle (AAIC) to dynamically adjust thresholds in real time.
· Cross-Link & Visualize
- Look for overlaps across AddQual, NASA, and CAD entries (e.g., dimension fails vs. reported incidents) to uncover insights.
- Use standard visualization tools to build 3D or time-series plots for further analysis.
· Further Details
- Refer to the accompanying paper for prompt designs, data extraction approaches, and domain-specific usage examples.
Dataset Files
- Combined datasets ATLASky-AI_4D_Spatiotemporal_Aerospace_Benchmark.zip (956.32 kB)
- Separate Datasets.zip (761.67 kB)
- AtlaSkI-AI.zip (249.56 kB)
Documentation
| Attachment | Size |
|---|---|
| 162.79 KB |


