Datasets
Standard Dataset
Reorganization of US48 Time Zones for Savings in Fuel and Carbon Emission
- Citation Author(s):
- Submitted by:
- Amlan Chakrabarti
- Last updated:
- Tue, 05/21/2024 - 07:59
- DOI:
- 10.21227/58sv-6q98
- Data Format:
- Links:
- License:
 29 Views
- Categories:
- Keywords:
Abstract
It is observed from the pattern of Electricity Demand in the months of November 2022 and March 2023 that switchover from Summer Time to Winter Time and vice versa causes a shift in demand pattern corresponding to the time shifts. The hourly electricity demands of US48 states have been shown in separate excel files for November 2022 and March 2023. In sheet 2 of both the excel files, a graphical plot of the average hourly demands in the week before the switchover has been compared with a graphical plot of the average hourly demands in the week after the switchover.
Using the above observations, an attempt has been made to determine the best suitable Time Zone configuration of a geographic territory for maximization of the savings in fuel and carbon emission in electricity generation.
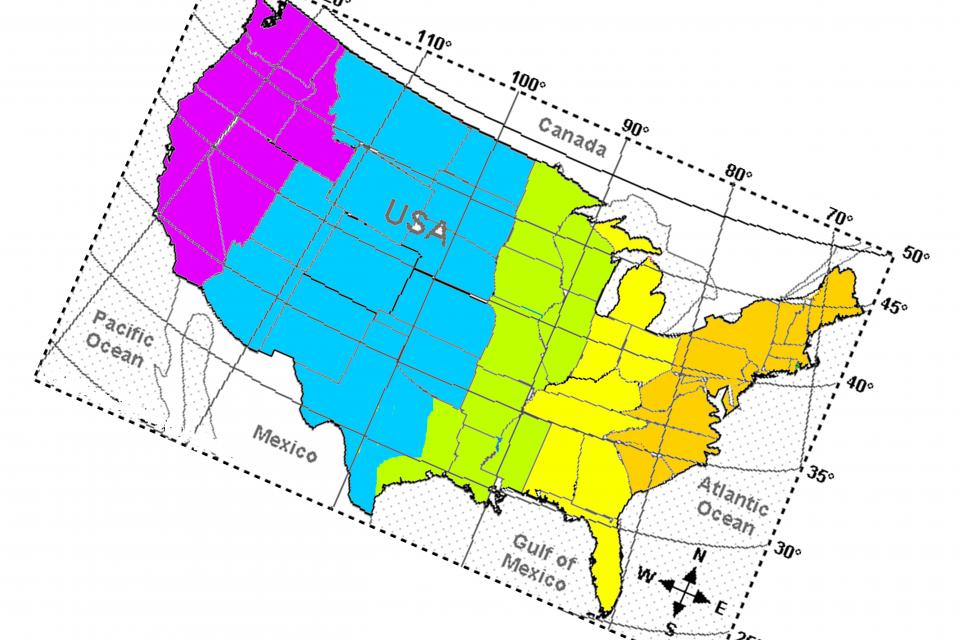
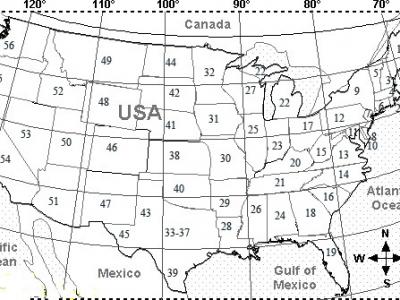
A geographic territory has a fixed longitude distance from east to west. This distance shall limit the maximum number of possible time zones in the territory. For best results, an odd number of time zones can result in maximum reduction in peak demand in electricity. In a published research paper by the author, it has been shown that for US48 states, 5 time zones are expected to provide best results in reducing the peak electricity demand and flattening the electricity demand curve [1]. The Time Zone Configuration has been presented in a map of US48 states. Also, it has been presented in tabular form using an excel file.
The original dataset uploaded here in an excel file is that of hourly electricity demand of US48 states during the month of August 2022 as published by the USEIA (Exhibit-1). By applying the demand shift methodology of the published research paper, a projected demand dataset has been prepared for August 2022 in another excel file (Exhibit-2). The computation of demand differentials achieved on each day of August 2022 has been presented in a separate excel file (Exhibit-3). The computation of savings in maintenance expenses, savings in fuel expenses, savings in tons of carbon emission and its social cost for each day of August 2022 have been estimated in a tabular form and presented in an excel file (Exhibit-4). The total savings for the month of August 2022 has been estimated at USD 50 million and 0.5 million tons of CO2. The savings in USD and CO2 are consistent for each day of August 2022.
Two assumptions have been made for computation of the savings.
1. Price of Natural Gas as fuel is the September 2023 price – USD 3.03 per MMBTU.
2. Social Cost of Carbon Emission is as per the 2022 estimate by the US Administration – USD 51 per ton of CO2.
1. Open the excel file named “US48_hourly_demand_Nov2022”. The first Sunday of November 2022 was on November 6, 2022. The switchover from Summer Time to Winter Time occurred at 2 AM and the time was decreased by one hour with respect to the UTC. Total Hourly Electricity Demand data of US48 states have been shown in the Sheet 1 of this file from October 30, 2022 to November 12, 2022. Hourly data for each date have been displayed in a separate row. Average of the hourly demand for the week before November 6, 2022 has been displayed in this sheet in a separate row. Average of the hourly demand for the week from November 6, 2022 has been displayed in this sheet in another row. In sheet 2 of this file, the above two average demand data have been plotted for all the 24 hours. It can be observed that the pattern of hourly demand for the average after November 6 has occurred one hour before the occurrence of the average before November 6.
2. Open the excel file named “US48_hourly_demand_March2023”. The second Sunday of March 2023 was on March 12, 2022. The switchover from Winter Time to Summer Time occurred at 2 AM and the time was increased by one hour with respect to the UTC. Total Hourly Electricity Demand data of US48 states have been shown in the Sheet 1 of this file from March 5, 2023 to March 18, 2023. Hourly data for each date have been displayed in a separate row. Average of the hourly demand for the week before March 12, 2023 has been displayed in this sheet in a separate row. Average of the hourly demand for the week from March 12, 2023 has been displayed in this sheet in another row. In sheet 2 of this file, the above two average demand data have been plotted for all the 24 hours. It can be observed that the pattern of hourly demand for the average after March 12 has occurred one hour after the occurrence of the average before March 12.
3. Open the excel file named “Exhibit1_existing_August2022”. Hourly Electricity Demand data for each day of August has been shown in a separate sheet. There are 31 such sheets in this excel file. Hourly Demand data for each Electricity Utility has been shown in a separate row for all the hours in a day with some overlapping hourly data from previous day and next day. The data rows have been sorted in the descending order of Longitude at the midpoint of the area of operation (Column AK). Breakup of Hourly Demand data for each state is required for this research work. As some of the utilities spread across many states, breakup of hourly data for each state is not readily available. For such cases, state-wise share of demand has been worked out from historical data. As Texas is a large state, the demand of ERCOT (Electricity Utility of Texas) has been broken up according to its Electricity Regions. The computed total of the hourly demand for all utilities has been shown in the row next to the total US48 demand as published by USEIA. The difference is within 20 MW for each hour. This can be explained as decimal approximation error in the presentation of data. The peak demand and off-peak demand has been shown with BOLD numbers in the computed total row. The data organization in the sheets is given below.
Column A – Name of the Utility and State.
Columns B to AG – Hourly Demand with the specific hour given in the header row.
Column AH – Name of the States where the Utility operates.
Column AI – Longitude of the eastern edge of the unit area under operation.
Column AJ - Longitude of the western edge of the unit area under operation.
Column AK - Longitude of the midpoint of the unit area under operation.
Column AL – Present Time Zone for Daylight Saving months.
Column AM – Proposed Time Zone for Daylight Saving months.
Column AN – The share of the State in the Hourly Demand of the Utility, if the same has been applied in data computation.
Column AO – Progressive Demand from East to West for the hour of maximum demand variation during the day (Subject to the condition that the concerned hour must be within three hours of the hour of Peak or Off-peak demand). This is required for the determination of the proposed Time Zone in Column AM.
In addition, the region-wise and state-wise Hourly Demands as available from USEIA published data are also included in each of the 31 date-wise sheets for checking the accuracy of utility data.
4. From the computations in Columns AO and AM in all sheets of excel file “existing_August2022”, the proposed Time Zones for US48 states are presented in excel file “US48_TimeZones” and JPG file “US48_TimeZones_map”.
5. Open the excel file named “Exhibit2_projected_newTimeZones_August2022”. The data organization in the sheets of this file is exactly similar to the sheets in the excel file named “existing_August2022” with exclusion of Columns AN and AO. The hourly data has been advanced by ‘n’ hours where ‘n’ is the difference between the proposed and existing time zones (n = AM – AL). As evident, if the time zone for a unit area has changed from ‘UTC-4’ to ‘UTC-5’, the demands for the same area shall occur one hour later in the new time zone. There are a few small utilities that operate in more than one time zone. In these cases, partial shifting is applicable but not possible with available data. For these utilities, the hourly demands have not been shifted. The peak demand and off-peak demand has been shown with BOLD numbers in the computed total row.
6. Open the excel file named “Exhibit3_Differential_USA_August2022”. The demand differentials for both existing time zones and proposed time zones have been computed in row 5 and 8 of sheet 1 for all 31 days of August 2022. The demand differential is approximately lower by 7000 to 12000 MW on all days in case of the proposed time zones. It shall result in reduction of cycling operation of fossil-fuel based power plants. For USA, it is assumed that it will result in the reduction of cycling operation of Natural Gas power plants. The reduction in cycling operation has been computed in row 9 of sheet 1 for all 31 days of August 2022.
7. Open the excel file named “Exhibit4_Savings_CarbonEmission_August2022”. For all 31 days of August 2022, the savings in capital and maintenance expenses have been estimated in Row 5 of Sheet 1. The savings in CO2 emission have been estimated in Row 7. The savings in the fuel expenses of Natural Gas have been estimated in Row 9. The savings in the social cost of CO2 emission have been estimated in Row 10. The details of the methodology used are given in published research work of the author [1,2,3].
More from this Author
Dataset Files
- November2022_SwitchoverToStandardTime_data&plot US48_hourly_demand_Nov2022.xlsx (25.26 kB)
- March2023_SwitchoverToDST_data&plot US48_hourly_demand_March2023.xlsx (24.37 kB)
- ExistingDemand_August2022 Exhibit1_existing_August2022.xlsx (1.44 MB)
- Proposed_US48_Timezones_Table US48_TimeZones.xlsx (10.36 kB)
- Proposed_US48_Timezones_Map US48_TimeZones_map.jpg (4.30 MB)
- ProjectedDemand_August2022 Exhibit2_projected_newTimeZones_August2022.xlsx (1.03 MB)
- DemandDifferential_US48_August2022 Exhibit3_Differential_USA_August2022.xlsx (13.65 kB)
- Savings_CarbonEmissions_August2022 Exhibit4_Savings_CarbonEmission_August2022.xlsx (15.59 kB)
Documentation
| Attachment | Size |
|---|---|
| 13.1 KB | |
| 15.73 KB | |
| 14.42 KB |


Comments
None.