Datasets
Standard Dataset
Effectiveness of Area-to-Value Legends and Grid Lines in Contiguous Area Cartograms
- Citation Author(s):
- Submitted by:
- Michael Gastner
- Last updated:
- Wed, 07/17/2024 - 09:48
- DOI:
- 10.21227/k14t-k679
- Data Format:
- Research Article Link:
- Links:
- License:
 9 Views
- Categories:
- Keywords:
Abstract
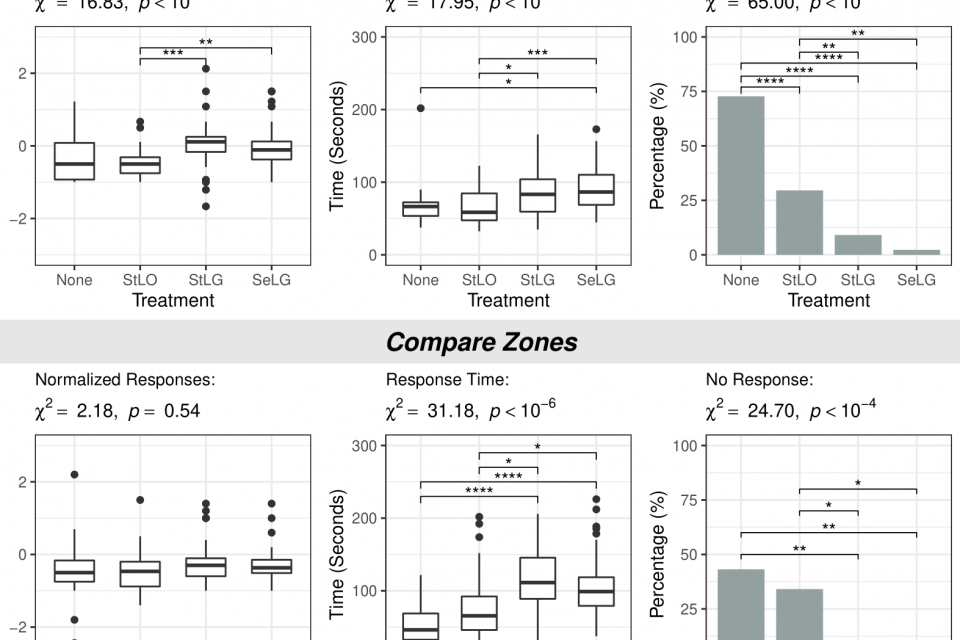
A contiguous area cartogram is a geographic map in which the area of each region is proportional to numerical data (e.g., population size) while keeping neighboring regions connected. In this study, we investigated whether value-to-area legends (square symbols next to the values represented by the squares' areas) and grid lines aid map readers in making better area judgments. We conducted an experiment to determine the accuracy, speed, and confidence with which readers infer numerical data values for the mapped regions. We found that, when only informed about the total numerical value represented by the whole cartogram without any legend, the distribution of estimates for individual regions was centered near the true value with substantial spread. Legends with grid lines significantly reduced the spread but led to a tendency to underestimate the values. Comparing differences between regions or between cartograms revealed that legends and grid lines slowed the estimation without improving accuracy. However, participants were more likely to complete the tasks when legends and grid lines were present, particularly when the area units represented by these features could be interactively selected. We recommend considering the cartogram's use case and purpose before deciding whether to include grid lines or an interactive legend.
Please download data and scripts in the same directory.
Dataset Files
- Data for paper "Effectiveness of Area-to-Value Legends and Grid Lines in Contiguous Area Cartograms" data.tar.gz (49.74 kB)
- R scripts used for data analysis scripts.tar.gz (19.31 kB)
Documentation
| Attachment | Size |
|---|---|
| 250 bytes |


