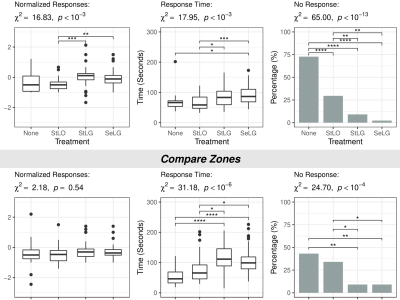
A contiguous area cartogram is a geographic map in which the area of each region is proportional to numerical data (e.g., population size) while keeping neighboring regions connected. In this study, we investigated whether value-to-area legends (square symbols next to the values represented by the squares' areas) and grid lines aid map readers in making better area judgments. We conducted an experiment to determine the accuracy, speed, and confidence with which readers infer numerical data values for the mapped regions.
- Categories:
