Two-wire communication channel with anomalies

- Citation Author(s):
- Submitted by:
- Francesco Picariello
- Last updated:
- DOI:
- 10.21227/439c-dp12
- Research Article Link:
 420 views
- Categories:
- Keywords:
Abstract
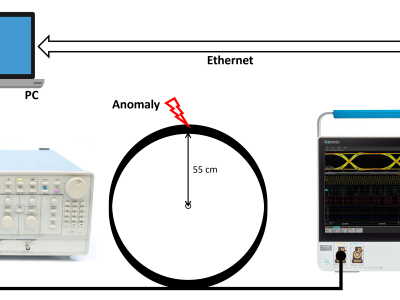
A dataset related to a cable under anomalies conditions while a transmitter (AWG) sends a binary PAM signal to a receiver. The signals are acquired by an oscilloscope. The anomalies were manually forced on the cable under test: air-exposed, water-exposed conductors, and tapping. In the dataset, the signals are also available for normal cable.
In particular, for the air-exposed conductor, the insulators were removed for both wires for a length of 5 cm to 50 cm with a step of 5 cm, and then a distance of 0.5 cm was kept between the two exposed wires to avoid short circuits. In the case of a water-exposed conductor, the cables were placed inside a water container that completely covered them once the insulation was removed. The anomaly lengths are chosen as for the air-exposed conductors. Another two-wire cable was soldered at half the wireline length for the tapping. The branch length was varied from 3 m to 15 m with a step of 3 m.
A number of 10000 records were acquired with the oscilloscope by considering a time window of 5.6 µs for each considered anomaly and in the case of a normal cable. For each record, a different PRBS was set by the AWG. In the case of air/water-exposed conductors, 1000 acquisitions were performed for each anomaly length, while for the tapping, they were 2000.
The experimental setup consists of the AWG 420 by Tektronix, which provides the binary PAM signal at the symbol rate of 125 MHz and with an amplitude of 0.5 V according to a PRBS of 1024 bytes. The signal is acquired by the oscilloscope MSO64B by Tektronix at a sampling frequency of 6.25 GSa/s, with a configured input impedance of 50 Ω and a bandwidth of 4 GHz. The oscilloscope works in high-resolution mode, thus exhibiting a resolution of 13 bits. The cable under test was a CAT 5E 4PR type and was placed around a circular structure with a radius of 55 cm and then connected to the oscilloscope input.
The dataset has been stored in MATLAB tables, which are contained in a .mat file for each type of anomaly.
The tables are organized as follows:
| Signal | Byte sequence | Type of defect | Length of defect | Pulse |
| 35000 x 1 samples y(n) | 1024 x 1 bytes | water/air/tap/normal | in meters | 35000 x 1 estimated pulse p(n) |
| | | | | | | | | | |
| | | | | | | | | | |
The first column contains the signal y(n) acquired by the oscilloscope, the second column the byte sequence sent by the AWG, the third column, the type of anomaly/defect, the fourth column the anomaly length, and the last column contains the p(n) signal obtained as deconvolution between the y(n) signal and an x(n) signal derived from the decoded byte sequence from the receiver side.
Instructions:
The .mat files are:
"airp.mat" for air-exposed conductor
"waterp.mat" for water-exposed conductor
"tapp.mat" for tapping
"normalp.mat" for normal cable (i.e., no anomalies)
In the dataset, some records are empty due to timeout events that occurred during the communication with the oscilloscope. Finally, 9913, 9632, 9684, and 9684 records were obtained for normal, air-exposed, water-exposed, and tapping, respectively.
Additional information is available on the paper:
E. Balestrieri, P. Daponte, L. D. Vito, F. Picariello, S. Rapuano and I. Tudosa, "A Passive-Measurement Method for Physical Security and Cable Diagnosis," in IEEE Transactions on Instrumentation and Measurement, vol. 74, pp. 1-12, 2025, Art no. 3508812, doi: 10.1109/TIM.2025.3541695.


