Datasets
Standard Dataset
Significance Comparison.
- Citation Author(s):
- Submitted by:
- Huang Gang
- Last updated:
- Sat, 12/07/2019 - 01:51
- DOI:
- 10.21227/yseh-r279
- Data Format:
- License:
 129 Views
- Categories:
- Keywords:
Abstract
Figure A and B:
A:▲:Comparison of total PTSD scores of the treatment group within before and after 1, 2 and 3 months treatment(P<0.01).▼:Comparison of total PTSD scores between treatment group and control group(P<0.01).■:Look at the control group, there was no significant difference between before treatment and 1 month after treatment(P>0.05), but there was significant difference in the 2 months after treatment(P<0.05), and the difference was more significant in the 3 months after treatment(P<0.01).
B: ▲:Comparison of the total FIM scores of the treatment group before and after 1, 2 and 3 months treatment(P<0.01).▼:Comparison of total FIM scores between treatment group and control group(P<0.01).■:Comparison of total PTSD scores of the control group before and after treatment in 1, 2 and 3 months(P<0.01).
Data expressed as mean ± standard error (SEM)
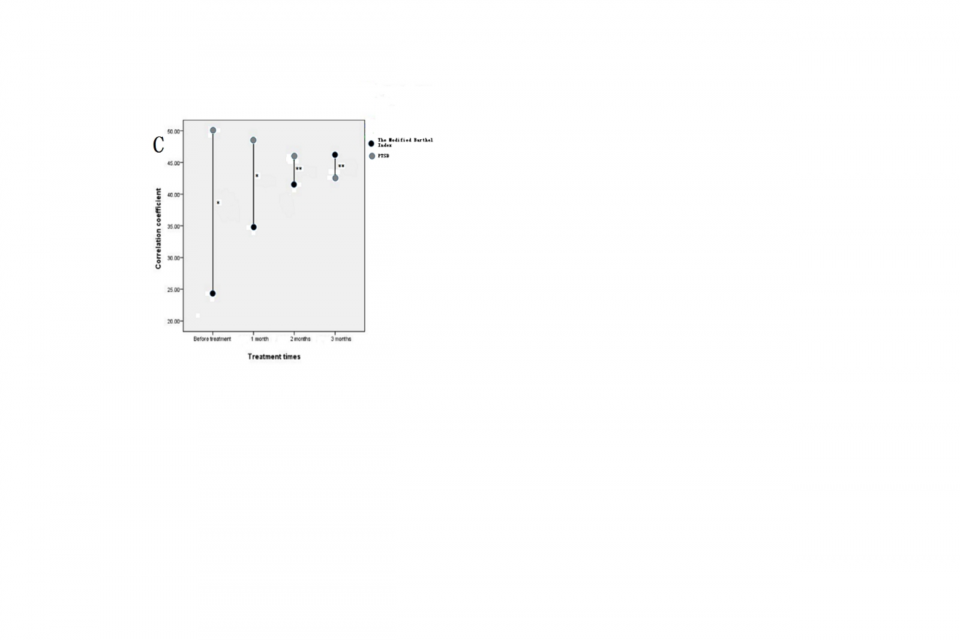
Figure C
The modified Barthel Index according to FIM scale was correlated with the total score of PTSD, and the data was expressed as mean ± standard error (SEM) * P < 0.05, * * P < 0.01.
Documentation
| Attachment | Size |
|---|---|
| 96.08 KB |


Comments
My team collected the data and, analyzed and significant contrast them under the guidance of Dr. Li Jiang-Bo. These data were used to analyze the SCI patients with PTSD.A significant difference between those who participated in psychological counseling and those who did not after they joined the basis of rehabilitation treatment.
We would like to share our research results and look forward to sharing your views.