Datasets
Standard Dataset
A novel spatial prediction method integrating Exploratory Spatial Data Analysis into Random Forest for large scale daily air temperature mapping
- Citation Author(s):
- Submitted by:
- Bingbo Gao
- Last updated:
- Wed, 03/19/2025 - 03:33
- DOI:
- 10.21227/hm70-9h79
- Research Article Link:
- License:
 209 Views
- Categories:
- Keywords:
Abstract
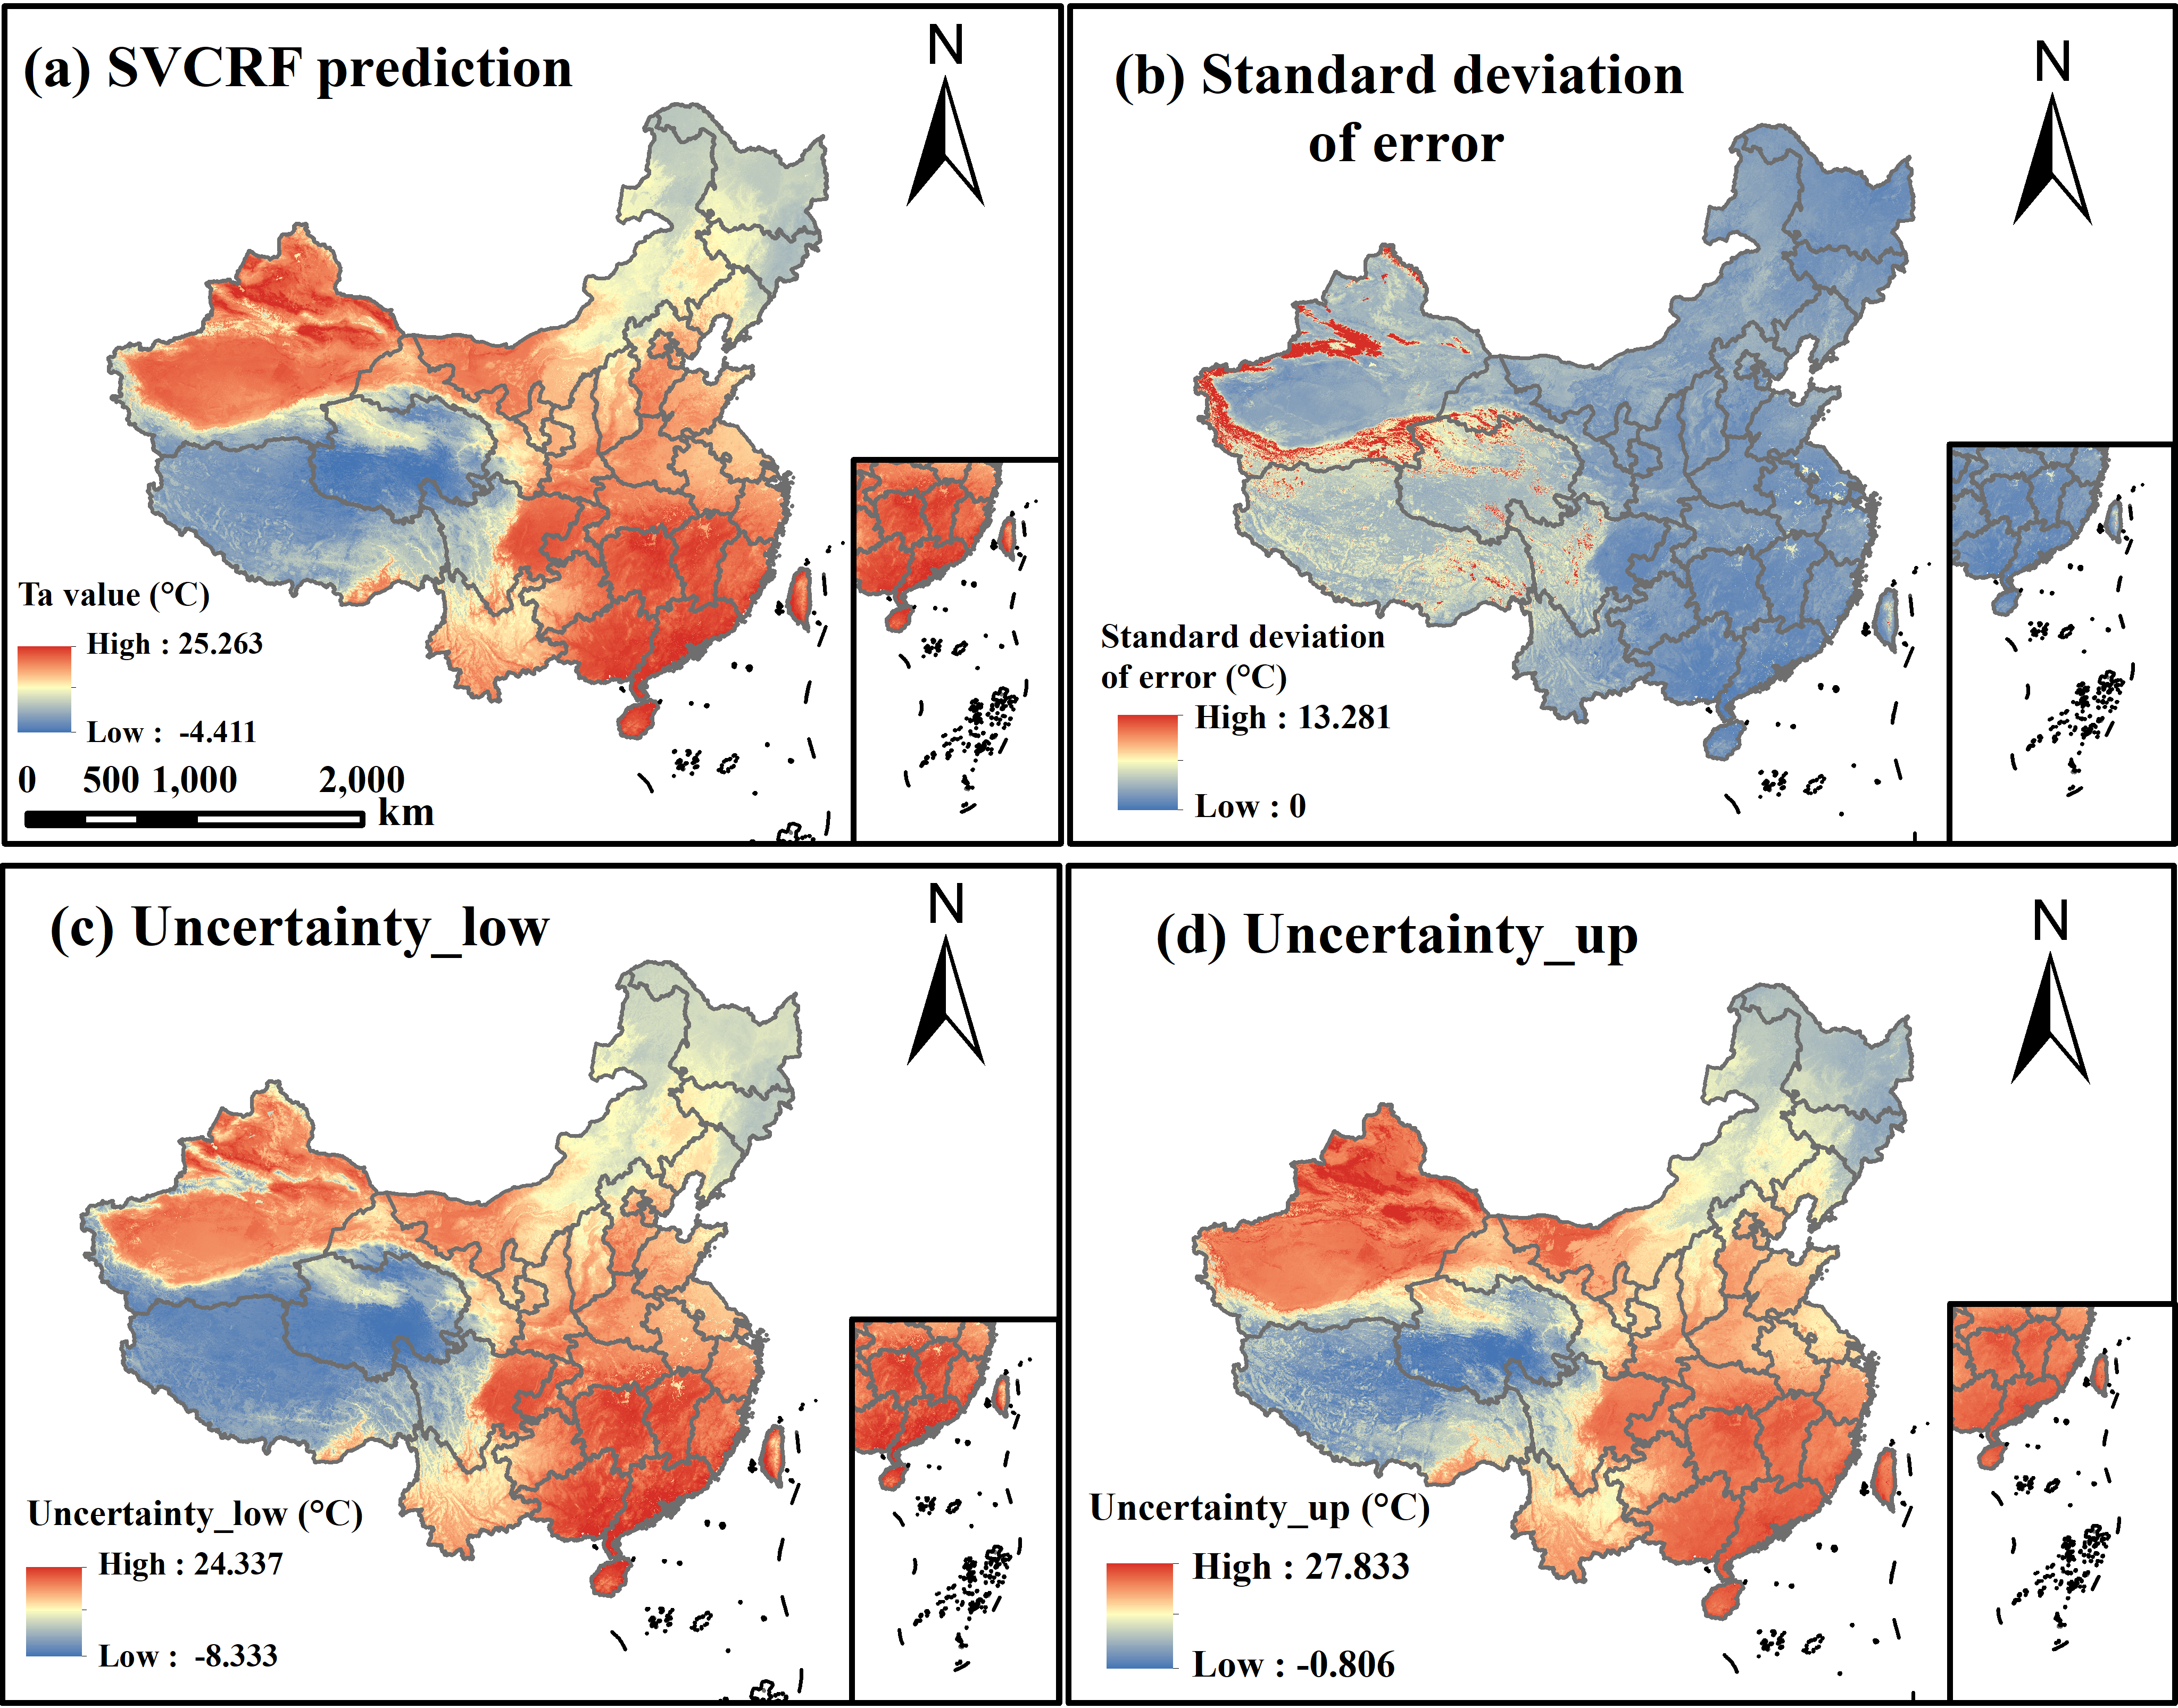
Accurately predicting spatially-continuous daily air temperature (Ta) is critical for agriculture, environmental management, and ecology. While meteorological stations provide precise Ta data, their spatial coverage is limited. Remotely-sensed Land Surface Temperature (LST), often fused with meteorological data, offers broader spatial coverage but struggles due to complex relationships between Ta and LST, influenced by factors like topography and human activities. Traditional supervised learning methods often fail to capture the spatial autocorrelation and heterogeneity inherent in the relationships, indicating the need for a more robust approach that integrates geographic knowledge. This study proposes the Spatially-Varying Coefficients Random Forest (SVCRF) model, to integrate Exploratory Spatial Data Analysis (ESDA) into Random Forest(RF) to capture spatially non-stationary relationships. It first stratifies the study area based on bivariate Local Indicators of Spatial Association and geographical detector,then builds several spatial RFs with specific spatial position and extent. In each spatial RF, the distance from observation/prediction sites to its position are added as a key predictor variable, to model the local spatial variations of the relationships within the spatial extent. Applied to daily Ta mapping at 1 km resolution across China using data from 5,425 meteorological stations, the SVCRF model demonstrated superior accuracy, achieving RMSE of 1.315 °C and MAE of 1.014 °C. Compared to RF, regression kriging, and geographically weighted regression, it reduced MAE by 0.351 °C, 0.786 °C, and 0.831 °C, respectively. The model also offers high interpretability, with uncertainty estimates aligning with actual errors and spatially-resolved variable importance highlighting spatial patterns.
The zip package includes the dataset and the code used.
Code name:
1. QautomationCom.R : It was used to calculate the bivariate local autocorrelation coefficients and the q-values under different stratifications.
2. SVCRF for CV.R : It was used for cross-validation.
3. Other methods for CV.R : It was used for cross-validation by other comparison methods.
4. SVCRFInterpolation0427InServer.R : It was used for interpolation prediction.
5. SVCRFrbind.R : It was used to merge the grided Ta data calculated from the SVCRFInterpolation0427InServer.R file.
6. CalSTD.R : It was used to calculate the uncertainty of the prediction results.
Data name:
1. 'QuadTree0427.csv' was used to calculate the bivariate local autocorrelation coefficients and the q-values under different stratifications.
2. 'Ta.csv', 'RU83ToPoint.csv' and 'ready for CV' were used for cross-validation.
3. 'res' were the CV results.
4. 'ready for interpolation', 'validateData' and 'Ta.csv' were uesd for interpolation prediction.
5. 'interpolationResult' were the grided Ta results calculated by the SVCRF, GWR, RF and RK models.
More from this Author
Documentation
| Attachment | Size |
|---|---|
| 1.04 KB |


