Datasets
Standard Dataset
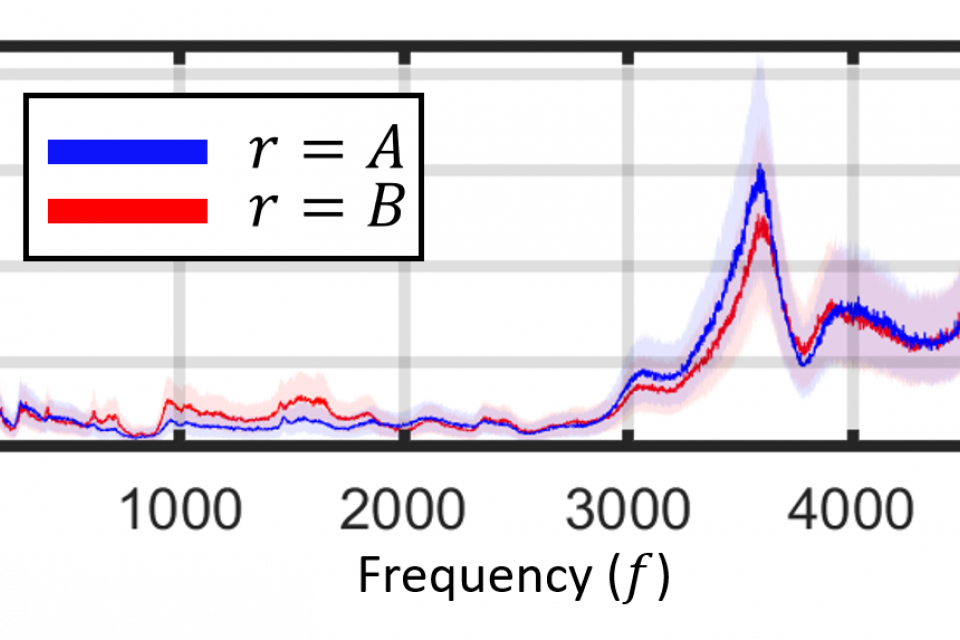
Frequency Spectrum for two classes of manufacturing process
- Citation Author(s):
- Submitted by:
- Akash Tiwari
- Last updated:
- Wed, 09/07/2022 - 17:28
- DOI:
- 10.21227/4s2y-5260
- Data Format:
- License:
 184 Views
- Categories:
- Keywords:
0 ratings - Please login to submit your rating.
Abstract
Frequency Spectra for an industrial polishing process under two different process conditions. The silhouettes of the spectra correspond to the 25th and 75th percentile of the energy for the 600 samples of spectra from each class.
Instructions:
The uploaded worksheet contains two sheets. The first sheet contains frequency spectra data for an industrial polishing process. The second sheet contains a simulated frequency spectra. Data in this second sheet corresponds to simulated frequency spectrum following GMM distribution. In the simulated frequency spectra for two classes, the two regions of frequency domain indicating differences are known apriori.The Readme file explains the tabular data in the two sheets of the uploaded worksheet.
Funding Agency:
National Science Foundation Division of Information and Intelligent Systems
Grant Number:
1849085


Comments
.