Behavioral Intentions of farmer's practicing Natural Farming
- Citation Author(s):
-
Aravind Kumar Saride
 (Indian Institute of Technology, Kharagpur)
Mrigank Sharad (Indian Institute of Technology, Kharagpur)
(Indian Institute of Technology, Kharagpur)
Mrigank Sharad (Indian Institute of Technology, Kharagpur) - Submitted by:
- Aravind Kumar Saride
- Last updated:
- DOI:
- 10.21227/h6vs-p044
 28 views
- Categories:
- Keywords:
Abstract
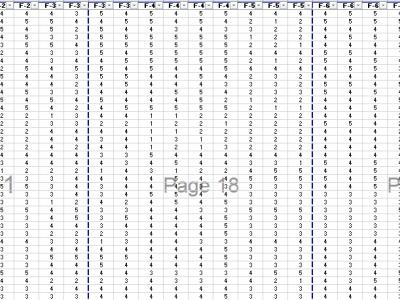
Data contains factors used to analyze the behavioral intentions of farmers. This dataset consists of ordinal survey responses collected across multiple features. Each feature appears to be evaluated on a 1–5 scale, where 1 indicates strong disagreement and 5 indicates strong agreement. The data is organized in a tabular format with a consistent structure across multiple pages. It is suitable for various statistical analyses, including factor analysis. This dataset is highly versatile. It supports simple descriptive reporting, reliability testing, factor extraction, complex modelling through SEM, and respondent segmentation through clustering. These analyses together can provide deep insights into the structure, reliability, and predictive power of the features being studied.
Instructions:
This dataset contains ordinal-scale data (ratings from 1 to 5) across several features (F-1 to F-7). Each row represents a respondent's rating on these different factors. The structure of the dataset is highly suitable for a variety of quantitative analyses, ranging from basic descriptive statistics to more advanced multivariate modelling techniques such as Structural Equation Modeling (SEM).
First, descriptive statistical analysis can be conducted to summarize and understand the basic characteristics of the data. Techniques such as calculating means, medians, modes, and standard deviations for each feature can offer insights into central tendencies and variability. Additionally, frequency distributions can help identify how often each rating score (1 to 5) appears for each feature. Visualization tools like bar charts, histograms, and box plots can further aid in spotting patterns and anomalies within the data.
Next, reliability analysis is essential to assess the internal consistency among the features. Measures like Cronbach’s Alpha can indicate whether the set of features reliably measures an underlying construct. Item-total correlation analysis can also be performed to evaluate how well each individual feature correlates with the overall scale, helping decide whether all features should be retained for further analysis.
Exploratory Factor Analysis (EFA) can then be applied to uncover the underlying structure of the dataset without a prior hypothesis. By using factor extraction methods such as Principal Axis Factoring or Maximum Likelihood, and applying rotations like Varimax or Promax, researchers can explore whether features naturally group together into latent constructs (for example, satisfaction or perceived quality).
Following EFA, Confirmatory Factor Analysis (CFA) is used to test predefined theoretical relationships between observed variables and latent constructs. Here, researchers specify which features are expected to load onto which latent factors and then evaluate the model's fit using indices such as RMSEA, CFI, TLI, and SRMR. CFA helps in verifying if the data supports the hypothesized structure.
Moving forward, Structural Equation Modeling (SEM) allows testing of more complex relationships among multiple latent variables. To utilize this dataset for SEM, features can be grouped logically (e.g., F-1, F-2, and F-3 forming one latent factor such as User Satisfaction, and F-4, F-5, and F-6 forming another, like Perceived Quality). A measurement model is first created to validate relationships between latent and observed variables, followed by building a structural model to specify hypothesized paths between the constructs. For instance, a model could hypothesize that "Perceived Quality positively influences User Satisfaction." SEM can help understand both direct and indirect effects within the theoretical framework.
In addition to SEM, cluster analysis can be conducted to segment respondents based on their rating patterns. Techniques such as K-Means Clustering or Hierarchical Clustering can help identify distinct groups, such as highly satisfied versus moderately satisfied users, which is valuable for targeted interventions or marketing strategies.
Lastly, the dataset can be employed for predictive modeling purposes. Predictive techniques like logistic regression or ordinal regression are well-suited, given the ordinal nature of the data. Decision trees and random forests adapted for ordinal data can also be used to build models that predict outcomes such as overall satisfaction based on other feature ratings, enabling more informed decision-making.
Overall, this dataset is versatile and can be used for a range of statistical and modeling techniques, providing robust insights depending on the analytical goals.