Datasets
Standard Dataset
Automatic Control System for Precise Intravenous Therapy using Computer Vision-Based on Deep Learning
- Citation Author(s):
- Submitted by:
- Jaehwang Seol
- Last updated:
- Mon, 07/08/2024 - 15:58
- DOI:
- 10.21227/abx5-rr86
- Data Format:
- License:
 53 Views
- Categories:
- Keywords:
Abstract
We submitted the paper Automatic Control System for Precise Intravenous Therapy using Computer Vision-Based on Deep Learning and provide experimental data related to this.
The purpose of this paper is to improve the accuracy of intravenous (IV) infusion using artificial intelligence and feedback loops to prevent errors in the process of administering IV Therapy, and we applied the system we developed to achieve the goal.
Therefore, we applied the system sequentially while creating a prototype and provide the data obtained through experiments.
We conducted three experiments: peristaltic pump, dropping count, and feedback system.
All experiments were conducted in the same environment to ensure reproducibility.
★ We will provide you with details about the collected data files. ★
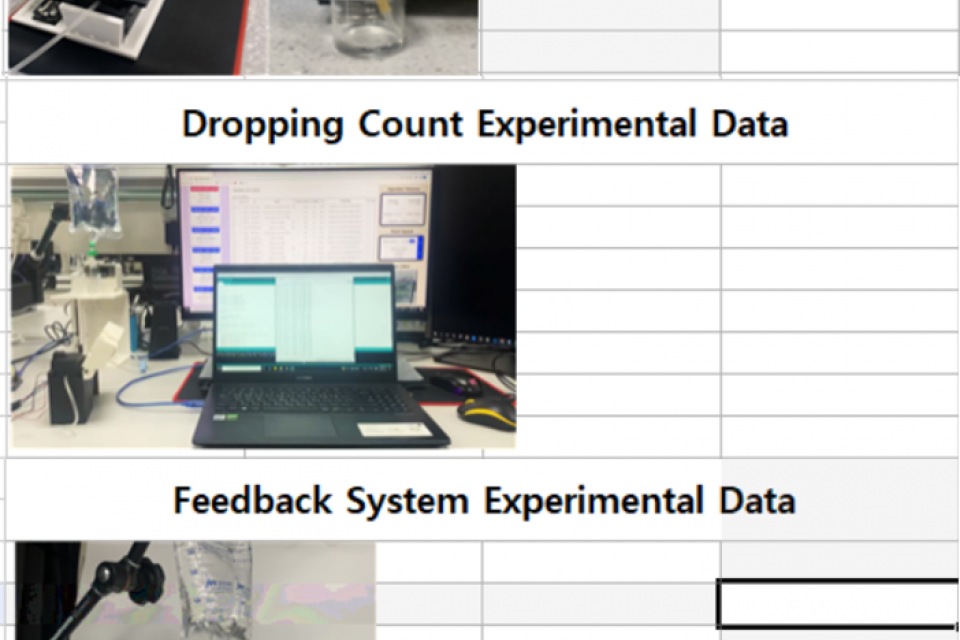
● The experiment was conducted in 3 sequential steps, consisting of peristaltic pump, dropping count, and feedback system.
● The peristaltic pump experimental data show the date, the number of measurements (Measure Count), the number of motor revolutions per measurement (Cycle Number), and the frequency of motor revolutions (Cycle Period). It also shows the time taken per measurement (Time), and the injected volume for each measurement (Injection Volume). Measurements such as average, deviation, standard deviation, and accuracy were obtained through 15 measurements, and you can see the functions used to calculate the statistics by clicking on the values in the cells inside the Excel.
● The dropping count experimental data were consist of date, flow rate (cc/hr), and four systems (Roller Clamp, Constant Value, A/D.1st, and A/D Vel.2nd). For each of the four systems, the following measurements were obtained according to the dropping count results for the experimental data: average, deviation, standard deviation, and accuracy, and you can see the functions used by clicking the values in the inner cells of the Excel.
● Feedback system The experimental data consist of the date, the targeted flow rate, and the targeted remaining time, and the experimental results include the measured injection volume, reamining volume, and remaining time. In addition, the current flow rate data were extracted in real time using Heidi SQL Tool during the experiment.
Documentation
| Attachment | Size |
|---|---|
| 1.53 KB |


