Cloud forensics is different than digital forensics because of the architectural implementation of the cloud. In an Infrastructure as a Service (IaaS) cloud model. Virtual Machines (VM) deployed over the cloud can be used by adversaries to carry out a cyber-attack using the cloud as an environment.
About the dataset
The dataset generated is a KVM monitoring dataset however we proposed a novel feature-set. The methodology used to generate these novel features are under publication and will be updated once the research article is published. This is one portion of the dataset. where the features can be used to train ML models for evidence detection.
The second portion of the dataset is published under the standard dataset of IEEE Dataport under the name of Memory Dumps of Virtual Machines for Cloud Forensics.
How to use
These two datasets can be used together as they are the outcome of the same experiment. Memory dumps have timestamp and VMID, UUID features.
or
This Dataset can be used to study the impact of an attack (origin) on the Rate of Resource utilization of a VM monitored at the hypervisor.
Sr No | Category | Feature | Description |
1 | Meta-data | LAST_POLL | epoch timestamp |
2 | VMID | The ID of the VM | |
3 | UUID | unique identifier of the domain | |
4 | dom | domain name | |
5 | Network | rxbytes_slope | Rate of received bytes from the network |
6 | rxpackets_slope | Rate of received packets from the network | |
7 | rxerrors_slope | Rate of the number of receive errors from the network | |
8 | rxdrops_slope | Rate of the number of received packets dropped from the network | |
9 | txbytes_slope | Rate of transmitted bytes from the network | |
10 | txpackets_slope | Rate of transmitted packets from the network | |
11 | txerrors_slope | Rate of the number of transmission errors from the network | |
12 | txdrops_slope | Rate of the number of transmitted packets dropped from the network | |
13 | Memory | timecpu_slope | Rate of time spent by vCPU threads executing guest code |
14 | timesys_slope | Rate of time spent in kernel space | |
15 | timeusr_slope | Rate of time spent in userspace | |
16 | state_slope | Rate of running state | |
17 | memmax_slope | Rate of maximum memory in kilobytes | |
18 | mem_slope | Rate of memory used in kilobytes | |
19 | cpus_slope | Rate of the number of virtual CPUs chaged | |
20 | cputime_slope | Rate of CPU time used in nanoseconds | |
21 | memactual_slope | Rate of Current balloon value (in KiB) | |
22 | memswap_in_slope | Rate of The amount of data read from swap space (in KiB) | |
23 | memswap_out_slope | Rate of The amount of memory written out to swap space (in KiB) | |
24 | memmajor_fault_slope | Rate of The number of page faults where disk IO was required | |
25 | memminor_fault_slope | Rate of The number of other page faults | |
26 | memunused_slope | Rate of The amount of memory left unused by the system (in KiB) | |
27 | memavailable_slope | Rate of The amount of usable memory as seen by the domain (in KiB) | |
28 | memusable_slope | Rate of The amount of memory that can be reclaimed by balloon without causing host swapping (in KiB) | |
29 | memlast_update_slope | Rate of The timestamp of the last update of statistics (in seconds) | |
30 | memdisk_cache_slope | Rate of The amount of memory that can be reclaimed without additional I/O, typically disk caches (in KiB) | |
31 | memhugetlb_pgalloc_slope | Rate of The number of successful huge page allocations initiated from within the domain | |
32 | memhugetlb_pgfail_slope | Rate of The number of failed huge page allocations initiated from within the domain | |
33 | memrss_slope | Rate of Resident Set Size of the running domain's process (in KiB) | |
34 | Disk | vdard_req_slope | Rate of the number of reading requests on the vda block device |
35 | vdard_bytes_slope | Rate of the number of reading bytes on the vda block device | |
36 | vdawr_reqs_slope | Rate of the number of write requests on the vda block device | |
37 | vdawr_bytes_slope | Rate of the number of write requests on vda the block device | |
38 | vdaerror_slope | Rate of the number of errors in the vda block device | |
39 | hdard_req_slope | Rate of the number of read requests on the hda block device | |
40 | hdard_bytes_slope | Rate of the number of read bytes on the had block device | |
41 | hdawr_reqs_slope | Rate of the number of write requests on the hda block device | |
42 | hdawr_bytes_slope | Rate of the number of write bytes on the hda block device | |
43 | hdaerror_slope | Rate of the number of errors in the hda block device | |
44 | TARGET | Status | Attack/Normal |
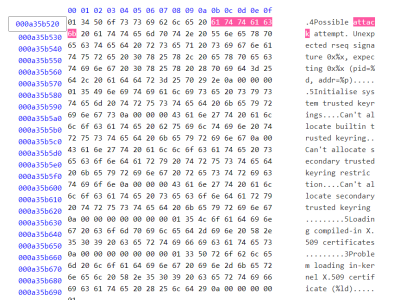
The dataset contains memory dump data which is generated continuously. For the experiment we carried out, we implemented the volatile data dump module which generated around 360 VM memory dump images of average size 800Mb each (Total 288GB). These data files are compressed using gzip utility. Further zipped to 79.5GB one single file of memory evidence.
Out of these preserved and stored memory dump dataset, 79 files of size 17.3GB were generated during the attack. This means the data 21.76% of data (in size) is potential evidence.
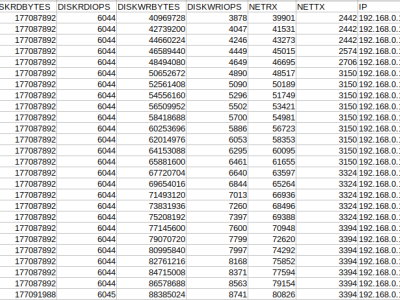
Intrusion Detection System can be build for private cloud using OpenNebula. OpenNebula is a cloud computing platform for managing heterogenous distributed data center infrastructure. The database is generated using a private cloud setup using KVM and OpenNebula. OpenNebula provides API to monitor Virtual Machines (VMs) running on the infrastructure. Total 6 VMs were deployed on the infrastructure. The monitoring data was collected over 63 Hours. Attacks were simulated on few of the VMs for variable time duration.